| __timestamp | Ferrovial SE | United Rentals, Inc. |
|---|---|---|
| Wednesday, January 1, 2014 | 983000000 | 1678000000 |
| Thursday, January 1, 2015 | 1027000000 | 2653000000 |
| Friday, January 1, 2016 | 943000000 | 2566000000 |
| Sunday, January 1, 2017 | 515000000 | 2843000000 |
| Monday, January 1, 2018 | 661000000 | 3628000000 |
| Tuesday, January 1, 2019 | 121000000 | 4200000000 |
| Wednesday, January 1, 2020 | 116000000 | 2195000000 |
| Friday, January 1, 2021 | 610000000 | 2642000000 |
| Saturday, January 1, 2022 | 756000000 | 5464000000 |
| Sunday, January 1, 2023 | 1524000000 | 6627000000 |
| Monday, January 1, 2024 | 4516000000 |
Unleashing insights
In the dynamic world of global infrastructure and equipment rental, United Rentals, Inc. and Ferrovial SE stand as titans. Over the past decade, United Rentals has consistently outperformed Ferrovial SE in EBITDA, showcasing a robust growth trajectory. From 2014 to 2023, United Rentals' EBITDA surged by approximately 295%, peaking in 2023. In contrast, Ferrovial SE experienced a more volatile journey, with a notable spike in 2023, reaching its highest EBITDA in the observed period.
This comparison underscores the strategic prowess of United Rentals in capitalizing on market opportunities, while Ferrovial SE navigates its path through economic challenges.
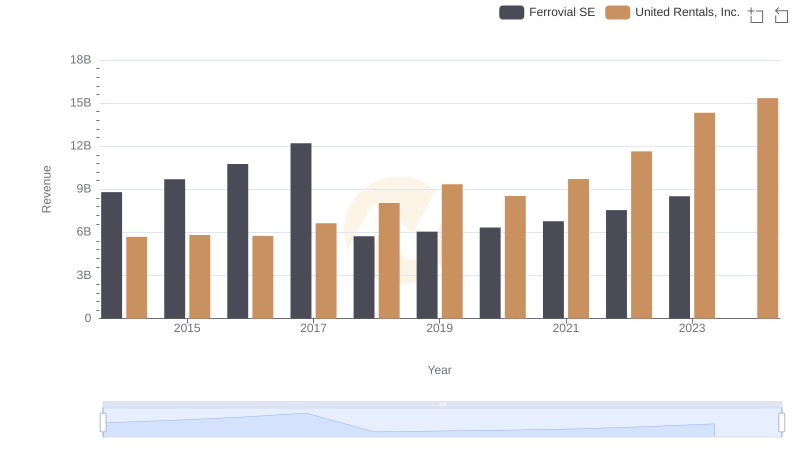
United Rentals, Inc. or Ferrovial SE: Who Leads in Yearly Revenue?
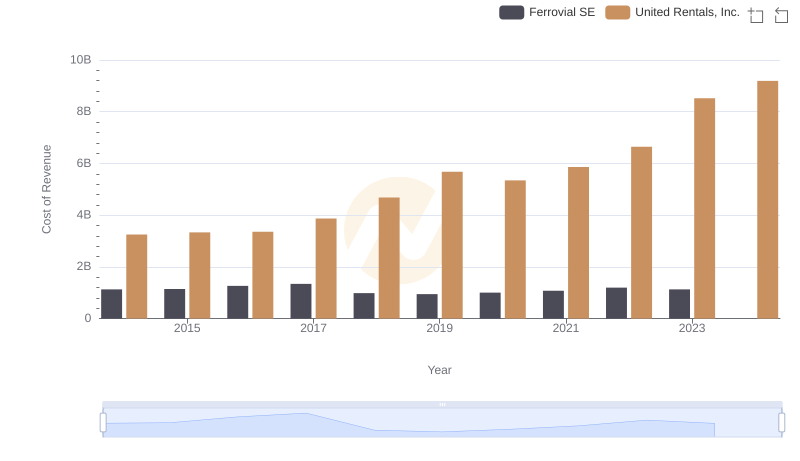
Analyzing Cost of Revenue: United Rentals, Inc. and Ferrovial SE
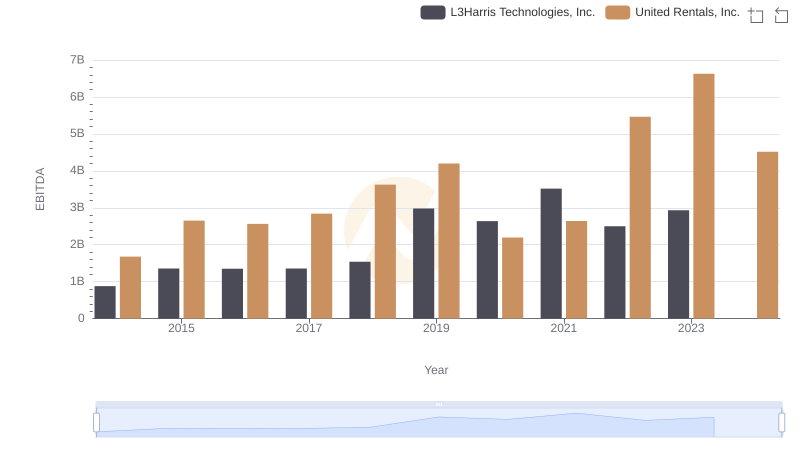
A Professional Review of EBITDA: United Rentals, Inc. Compared to L3Harris Technologies, Inc.
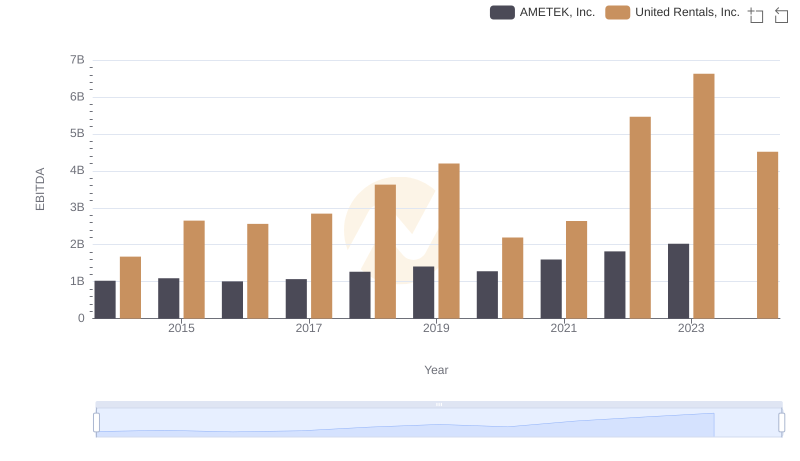
A Side-by-Side Analysis of EBITDA: United Rentals, Inc. and AMETEK, Inc.
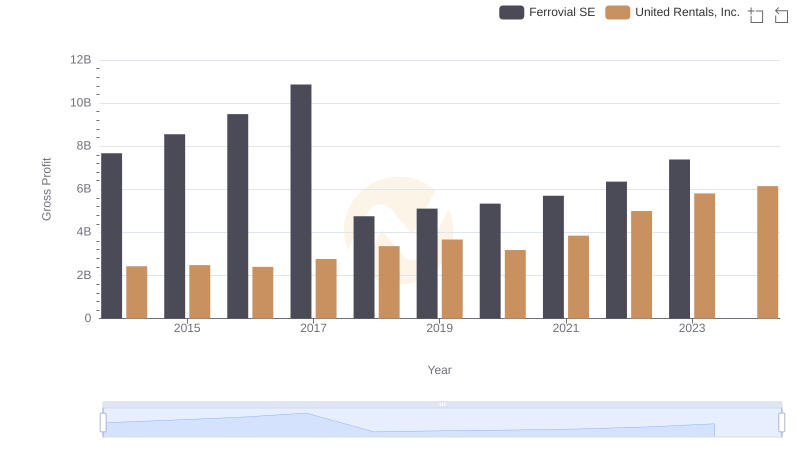
Who Generates Higher Gross Profit? United Rentals, Inc. or Ferrovial SE
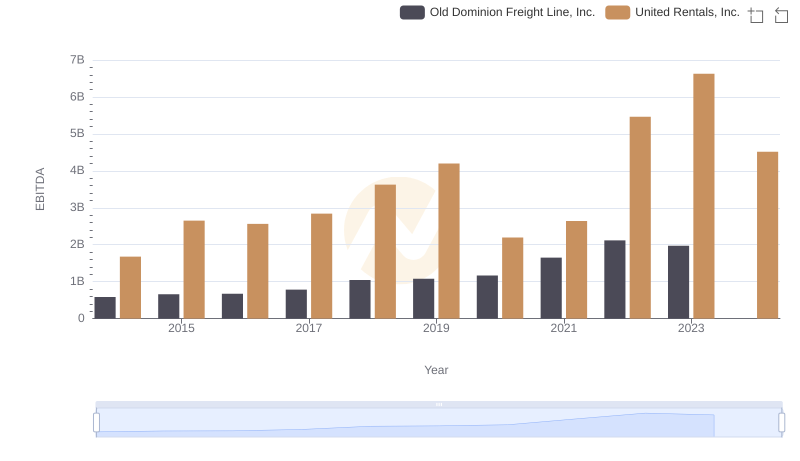
Professional EBITDA Benchmarking: United Rentals, Inc. vs Old Dominion Freight Line, Inc.
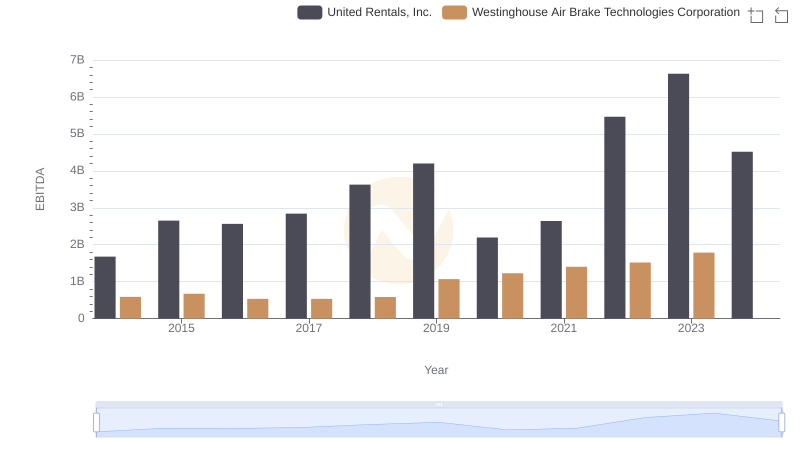
EBITDA Analysis: Evaluating United Rentals, Inc. Against Westinghouse Air Brake Technologies Corporation
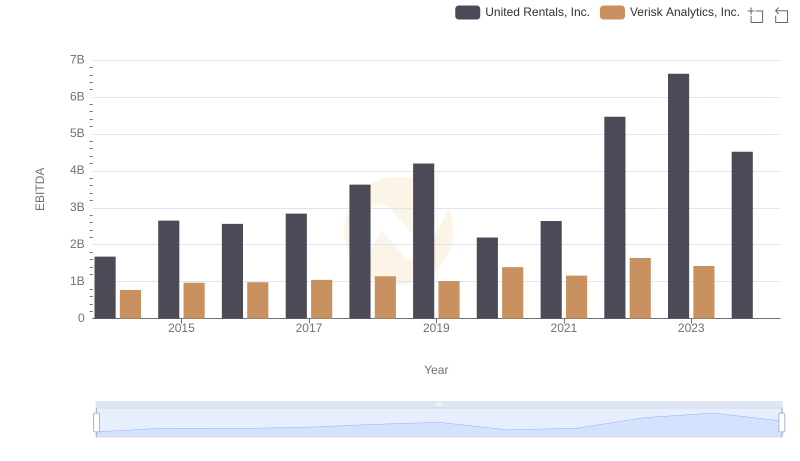
United Rentals, Inc. and Verisk Analytics, Inc.: A Detailed Examination of EBITDA Performance
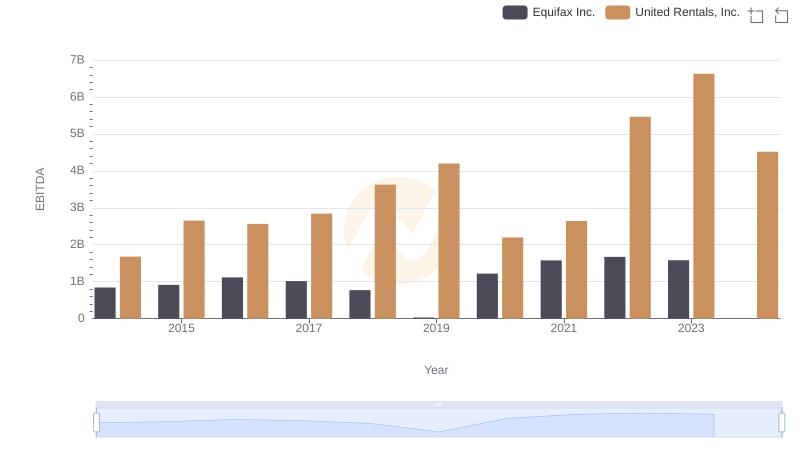
EBITDA Performance Review: United Rentals, Inc. vs Equifax Inc.
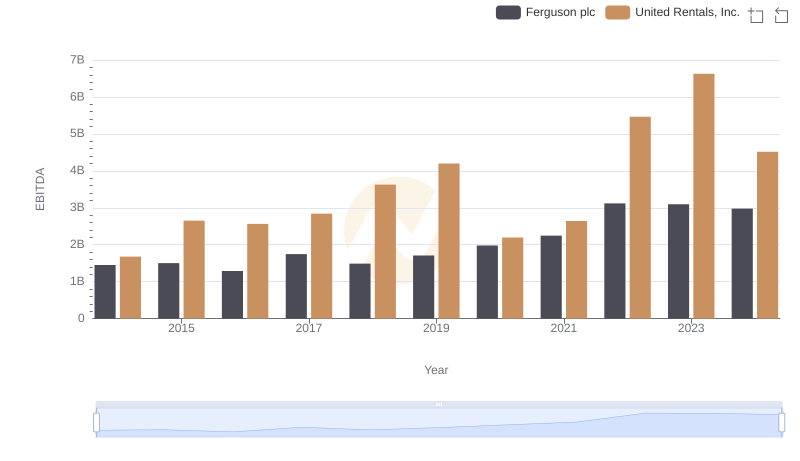
Comprehensive EBITDA Comparison: United Rentals, Inc. vs Ferguson plc
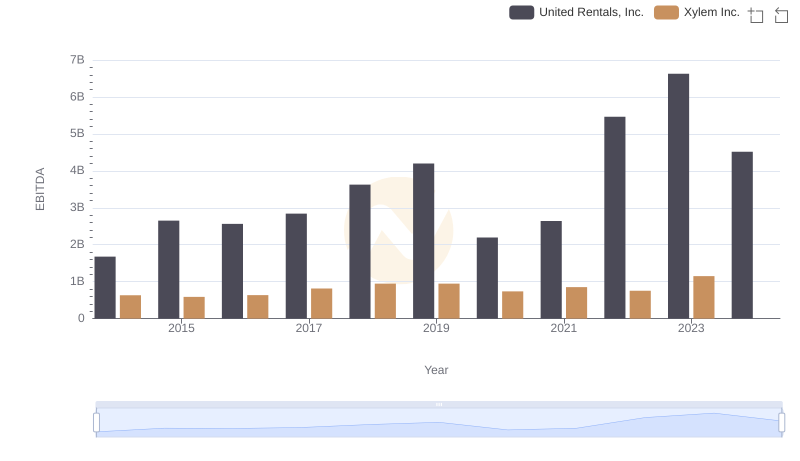
A Side-by-Side Analysis of EBITDA: United Rentals, Inc. and Xylem Inc.
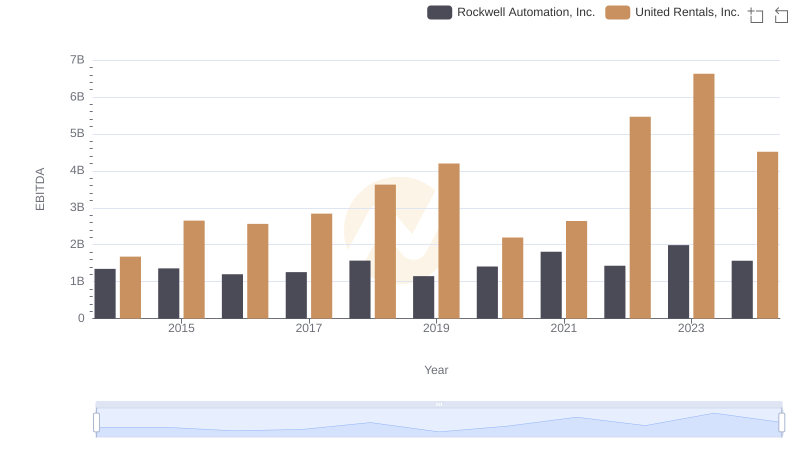
EBITDA Metrics Evaluated: United Rentals, Inc. vs Rockwell Automation, Inc.