| __timestamp | Curtiss-Wright Corporation | Rockwell Automation, Inc. |
|---|---|---|
| Wednesday, January 1, 2014 | 1466610000 | 3869600000 |
| Thursday, January 1, 2015 | 1422428000 | 3604800000 |
| Friday, January 1, 2016 | 1358448000 | 3404000000 |
| Sunday, January 1, 2017 | 1452431000 | 3687100000 |
| Monday, January 1, 2018 | 1540574000 | 3793800000 |
| Tuesday, January 1, 2019 | 1589216000 | 3794700000 |
| Wednesday, January 1, 2020 | 1550109000 | 3734600000 |
| Friday, January 1, 2021 | 1572575000 | 4099700000 |
| Saturday, January 1, 2022 | 1602416000 | 4658400000 |
| Sunday, January 1, 2023 | 1778195000 | 5341000000 |
| Monday, January 1, 2024 | 1967640000 | 5070800000 |
Unleashing insights
In the ever-evolving landscape of industrial automation and aerospace, Rockwell Automation, Inc. and Curtiss-Wright Corporation stand as titans. Over the past decade, these companies have showcased intriguing trends in their cost of revenue, reflecting their strategic maneuvers and market dynamics.
From 2014 to 2023, Rockwell Automation's cost of revenue surged by approximately 38%, peaking in 2023. This growth underscores their expanding footprint in the automation sector. In contrast, Curtiss-Wright Corporation experienced a more modest increase of around 21% over the same period, highlighting their steady yet cautious approach in the aerospace and defense industries.
Interestingly, 2023 marked a significant year for both companies, with Rockwell Automation reaching its highest cost of revenue, while Curtiss-Wright also saw a notable rise. However, data for 2024 remains incomplete, leaving room for speculation on future trends. As these industry leaders continue to innovate, their financial trajectories offer valuable insights into their strategic priorities.

Breaking Down Revenue Trends: Rockwell Automation, Inc. vs Curtiss-Wright Corporation
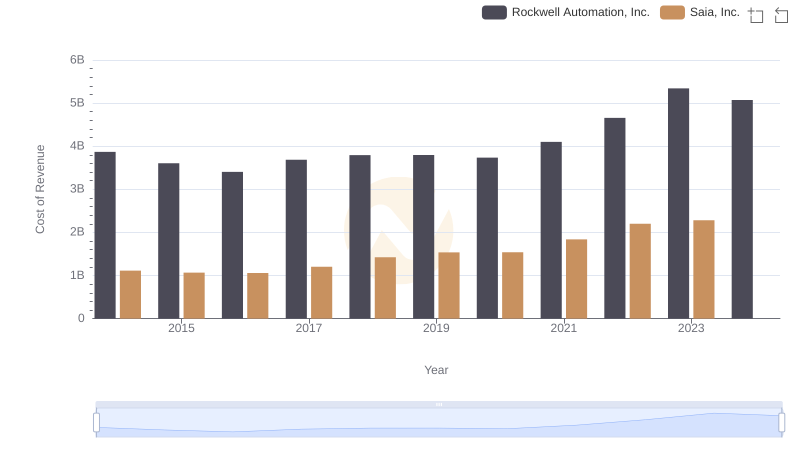
Cost of Revenue Comparison: Rockwell Automation, Inc. vs Saia, Inc.
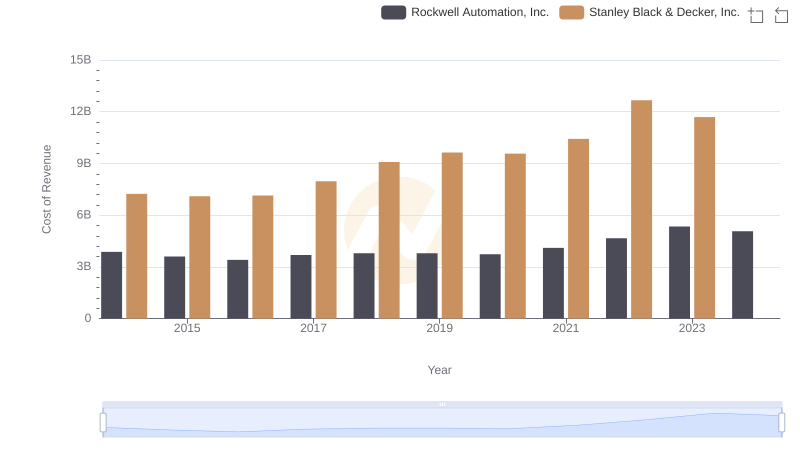
Rockwell Automation, Inc. vs Stanley Black & Decker, Inc.: Efficiency in Cost of Revenue Explored
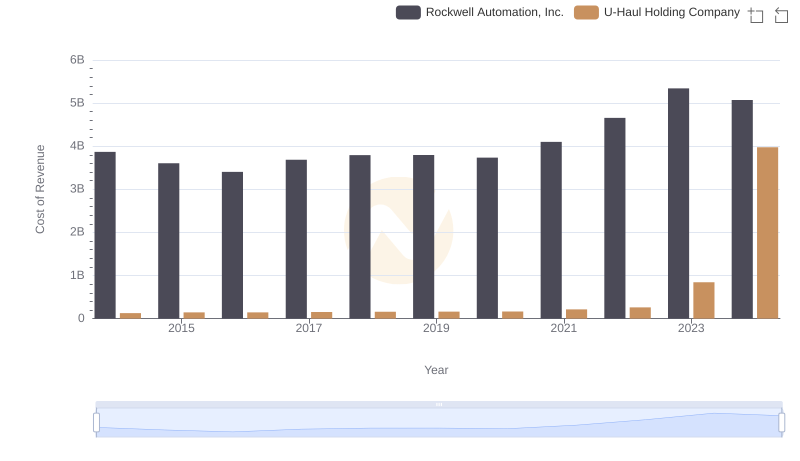
Analyzing Cost of Revenue: Rockwell Automation, Inc. and U-Haul Holding Company
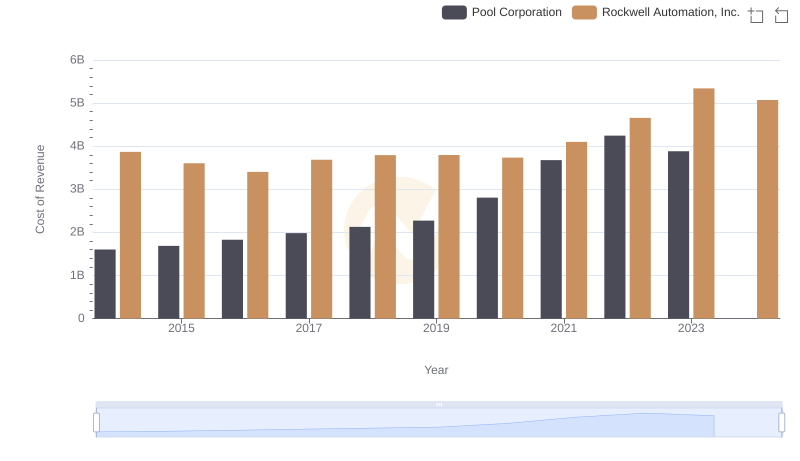
Analyzing Cost of Revenue: Rockwell Automation, Inc. and Pool Corporation
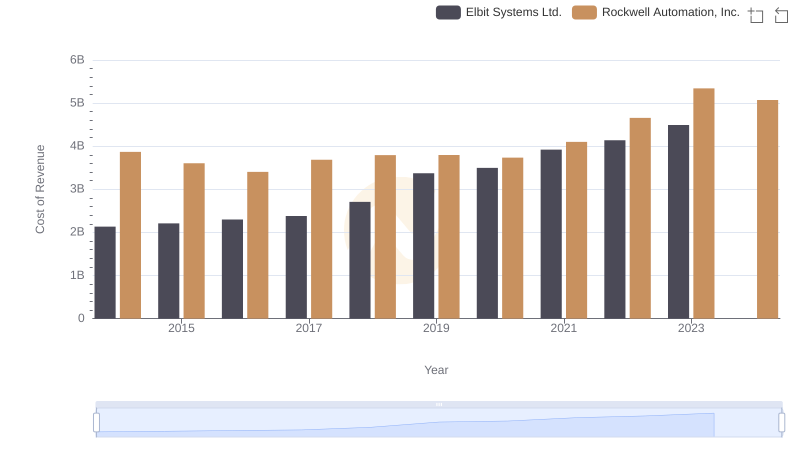
Cost Insights: Breaking Down Rockwell Automation, Inc. and Elbit Systems Ltd.'s Expenses
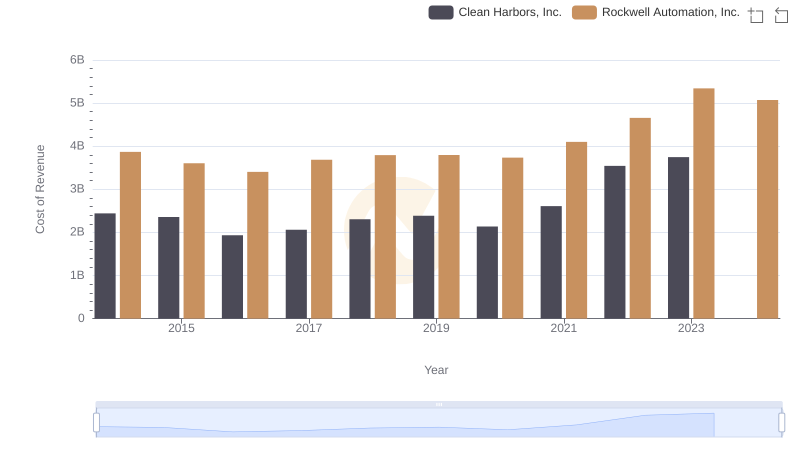
Comparing Cost of Revenue Efficiency: Rockwell Automation, Inc. vs Clean Harbors, Inc.
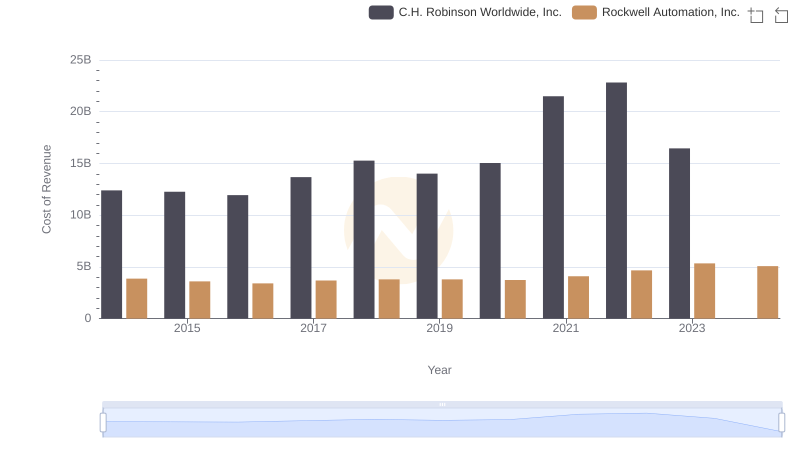
Analyzing Cost of Revenue: Rockwell Automation, Inc. and C.H. Robinson Worldwide, Inc.
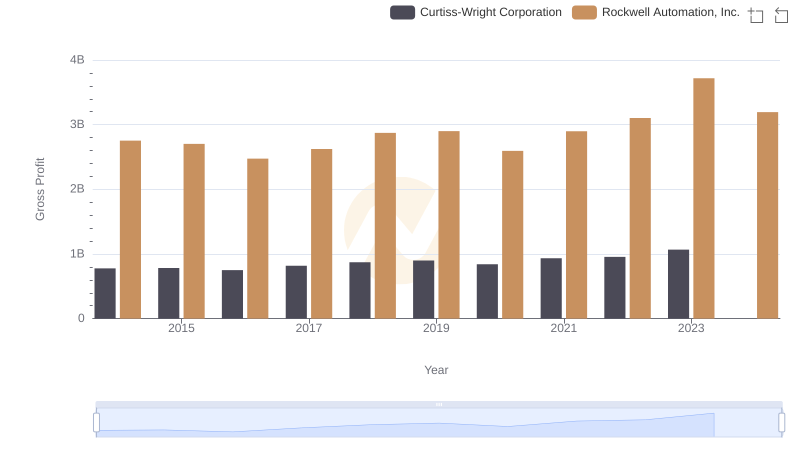
Rockwell Automation, Inc. and Curtiss-Wright Corporation: A Detailed Gross Profit Analysis
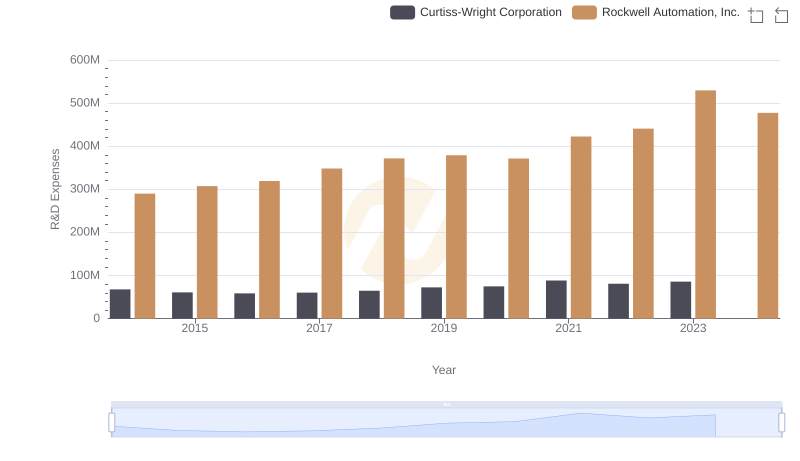
R&D Spending Showdown: Rockwell Automation, Inc. vs Curtiss-Wright Corporation
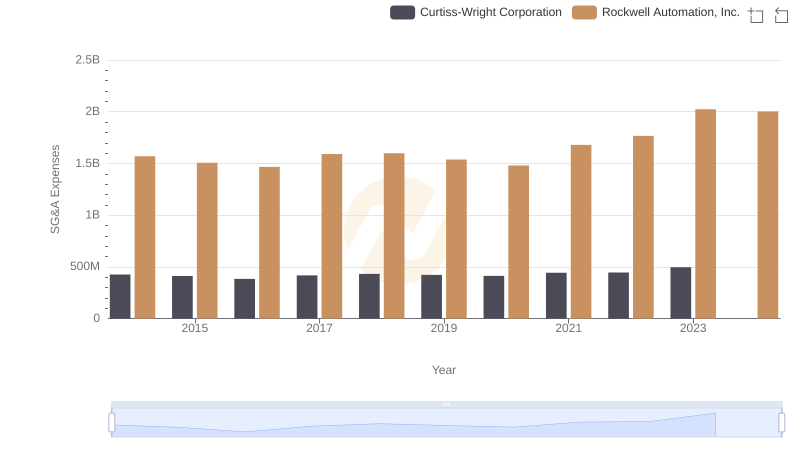
Comparing SG&A Expenses: Rockwell Automation, Inc. vs Curtiss-Wright Corporation Trends and Insights
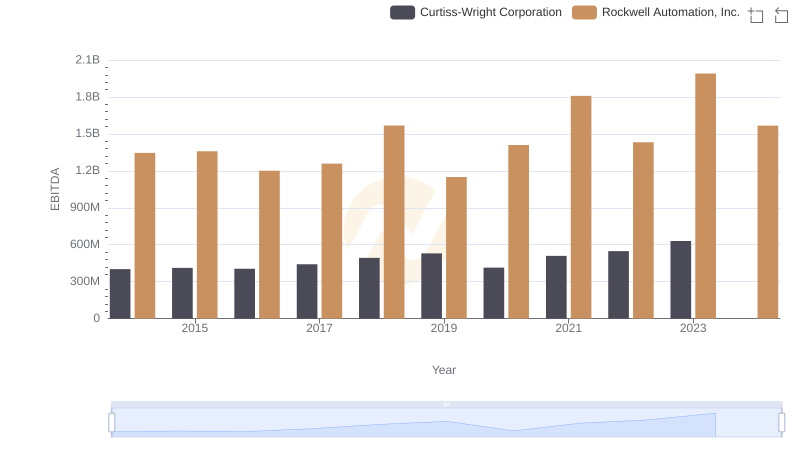
EBITDA Performance Review: Rockwell Automation, Inc. vs Curtiss-Wright Corporation