| __timestamp | Clean Harbors, Inc. | Rockwell Automation, Inc. |
|---|---|---|
| Wednesday, January 1, 2014 | 2441796000 | 3869600000 |
| Thursday, January 1, 2015 | 2356806000 | 3604800000 |
| Friday, January 1, 2016 | 1932857000 | 3404000000 |
| Sunday, January 1, 2017 | 2062673000 | 3687100000 |
| Monday, January 1, 2018 | 2305551000 | 3793800000 |
| Tuesday, January 1, 2019 | 2387819000 | 3794700000 |
| Wednesday, January 1, 2020 | 2137751000 | 3734600000 |
| Friday, January 1, 2021 | 2609837000 | 4099700000 |
| Saturday, January 1, 2022 | 3543930000 | 4658400000 |
| Sunday, January 1, 2023 | 3746124000 | 5341000000 |
| Monday, January 1, 2024 | 4065713000 | 5070800000 |
In pursuit of knowledge
In the ever-evolving landscape of industrial automation and environmental services, Rockwell Automation, Inc. and Clean Harbors, Inc. have showcased distinct trajectories in cost efficiency over the past decade. From 2014 to 2023, Rockwell Automation consistently maintained a higher cost of revenue, peaking in 2023 with a 38% increase from 2014. This reflects their expansive growth and investment in cutting-edge automation solutions. Meanwhile, Clean Harbors demonstrated a remarkable 54% rise in cost efficiency, culminating in 2023, as they expanded their environmental services footprint. Notably, 2022 marked a pivotal year for both companies, with Clean Harbors experiencing a 36% surge in cost efficiency, while Rockwell Automation saw a 12% increase. As we look to the future, the absence of data for Clean Harbors in 2024 leaves room for speculation on their strategic direction. This comparison underscores the dynamic nature of cost management in these industries.
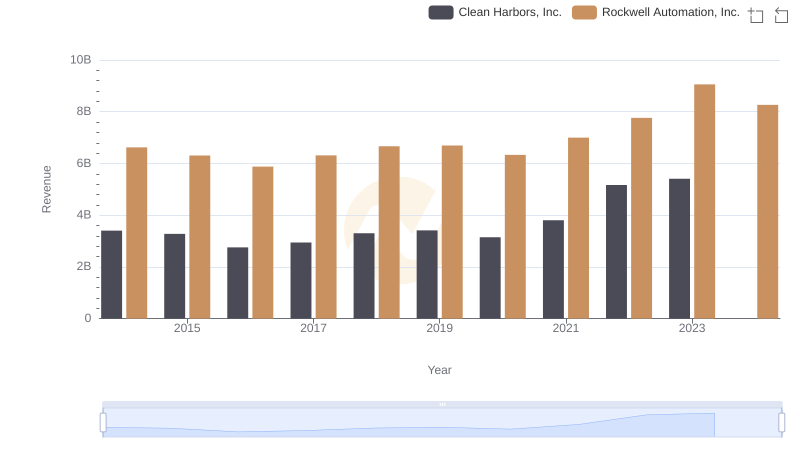
Comparing Revenue Performance: Rockwell Automation, Inc. or Clean Harbors, Inc.?
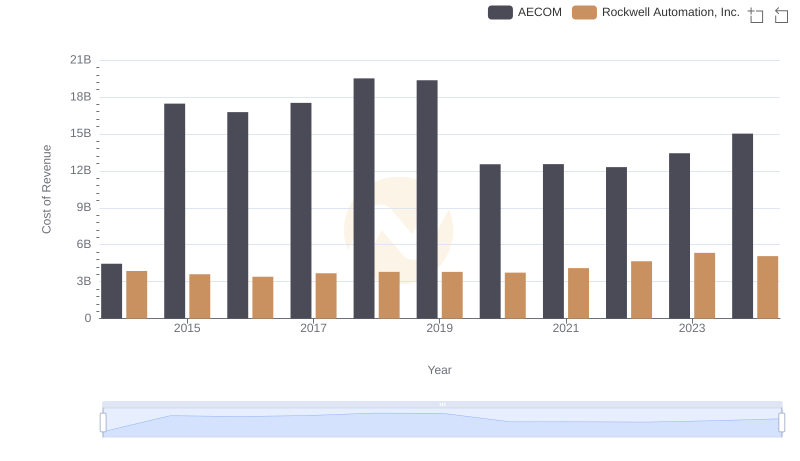
Cost of Revenue: Key Insights for Rockwell Automation, Inc. and AECOM
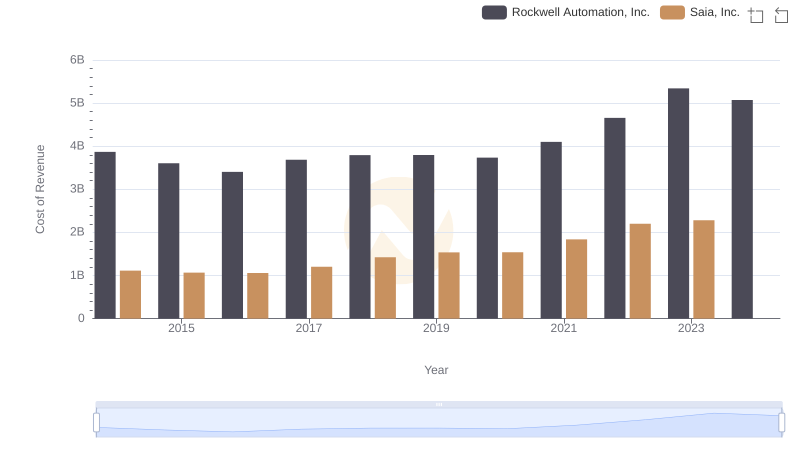
Cost of Revenue Comparison: Rockwell Automation, Inc. vs Saia, Inc.
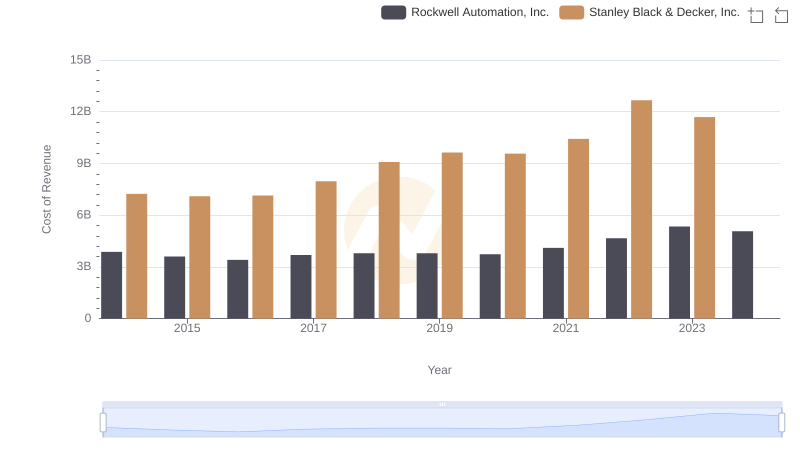
Rockwell Automation, Inc. vs Stanley Black & Decker, Inc.: Efficiency in Cost of Revenue Explored
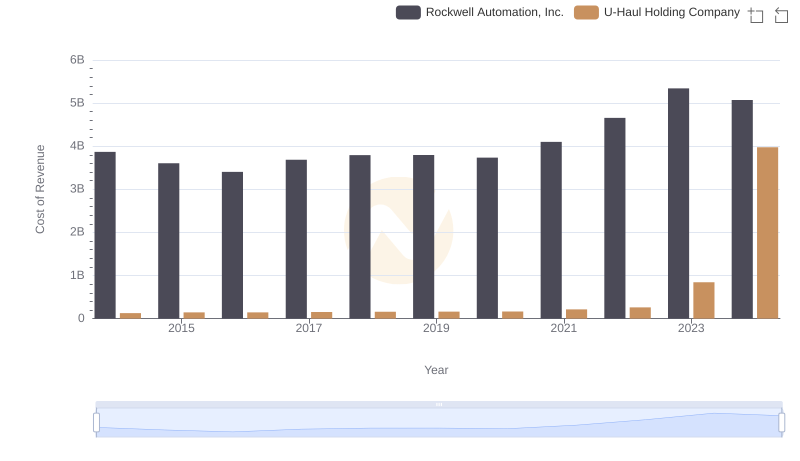
Analyzing Cost of Revenue: Rockwell Automation, Inc. and U-Haul Holding Company
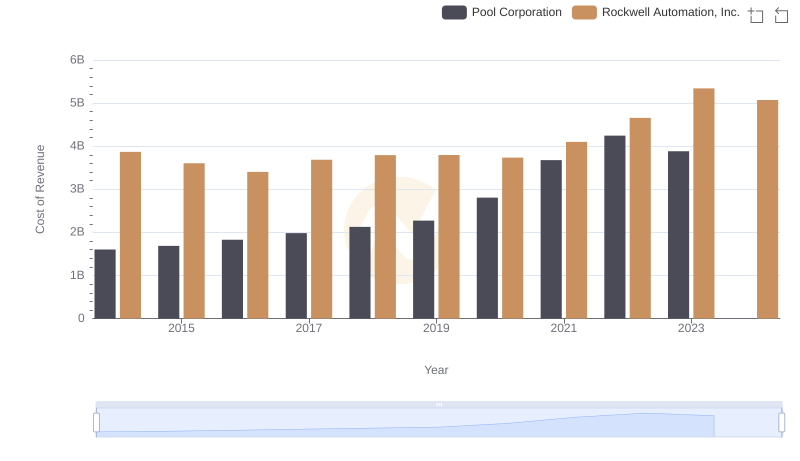
Analyzing Cost of Revenue: Rockwell Automation, Inc. and Pool Corporation
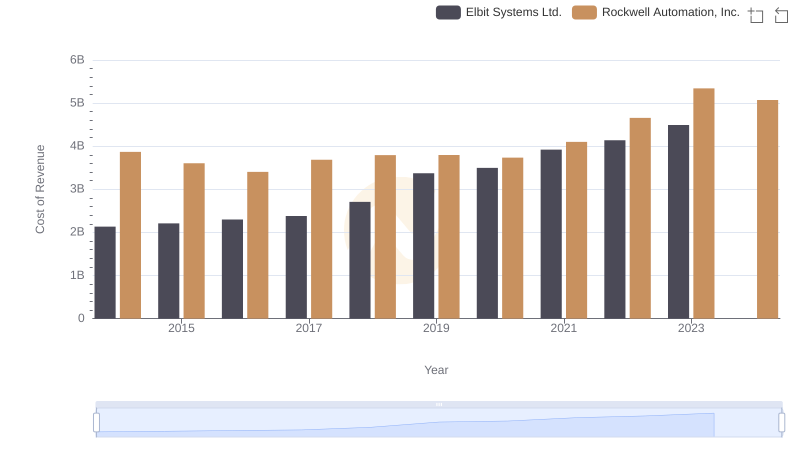
Cost Insights: Breaking Down Rockwell Automation, Inc. and Elbit Systems Ltd.'s Expenses
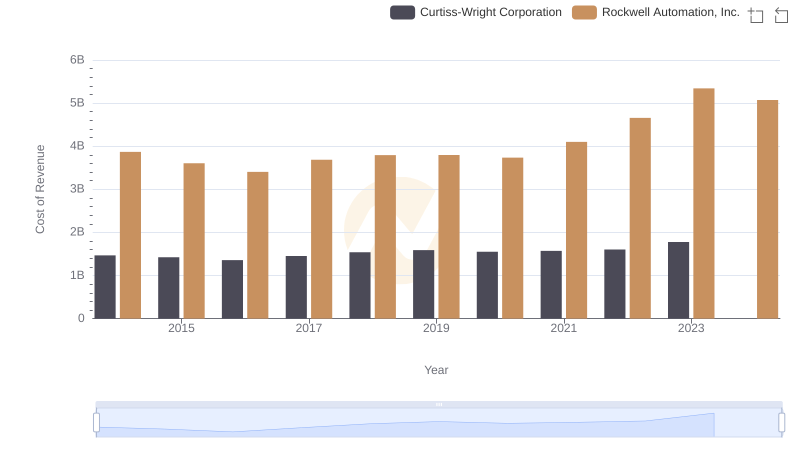
Cost of Revenue Trends: Rockwell Automation, Inc. vs Curtiss-Wright Corporation
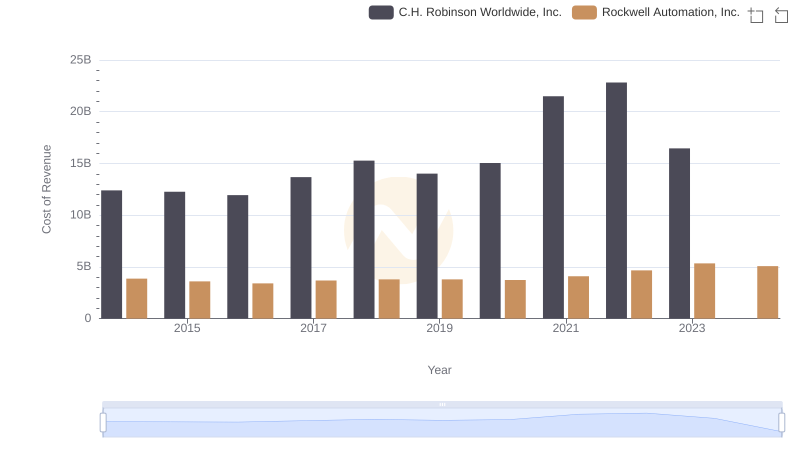
Analyzing Cost of Revenue: Rockwell Automation, Inc. and C.H. Robinson Worldwide, Inc.
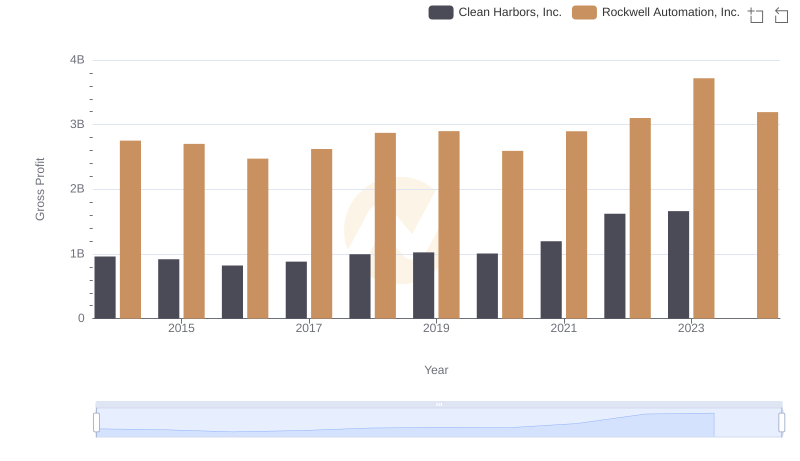
Rockwell Automation, Inc. vs Clean Harbors, Inc.: A Gross Profit Performance Breakdown