| __timestamp | Nordson Corporation | Rockwell Automation, Inc. |
|---|---|---|
| Wednesday, January 1, 2014 | 758923000 | 3869600000 |
| Thursday, January 1, 2015 | 774702000 | 3604800000 |
| Friday, January 1, 2016 | 815495000 | 3404000000 |
| Sunday, January 1, 2017 | 927981000 | 3687100000 |
| Monday, January 1, 2018 | 1018703000 | 3793800000 |
| Tuesday, January 1, 2019 | 1002123000 | 3794700000 |
| Wednesday, January 1, 2020 | 990632000 | 3734600000 |
| Friday, January 1, 2021 | 1038129000 | 4099700000 |
| Saturday, January 1, 2022 | 1163742000 | 4658400000 |
| Sunday, January 1, 2023 | 1203227000 | 5341000000 |
| Monday, January 1, 2024 | 1203792000 | 5070800000 |
Unleashing insights
In the ever-evolving landscape of industrial automation and manufacturing, Rockwell Automation, Inc. and Nordson Corporation stand as titans. Over the past decade, from 2014 to 2024, these companies have showcased distinct trajectories in their cost of revenue. Rockwell Automation, with its robust growth, saw a 38% increase in cost of revenue, peaking at approximately $5.34 billion in 2023. This reflects its aggressive expansion and innovation strategies. Meanwhile, Nordson Corporation exhibited a steady rise, with a 59% increase, reaching around $1.20 billion in 2024. This growth underscores Nordson's strategic investments in precision technology. The data highlights a fascinating contrast: while Rockwell's cost of revenue is significantly higher, Nordson's growth rate is more pronounced. This analysis offers a window into the strategic priorities and market dynamics influencing these industry leaders.
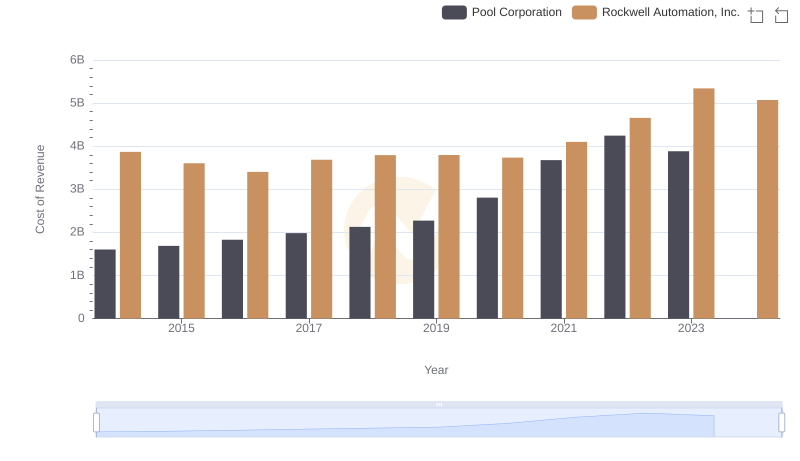
Analyzing Cost of Revenue: Rockwell Automation, Inc. and Pool Corporation
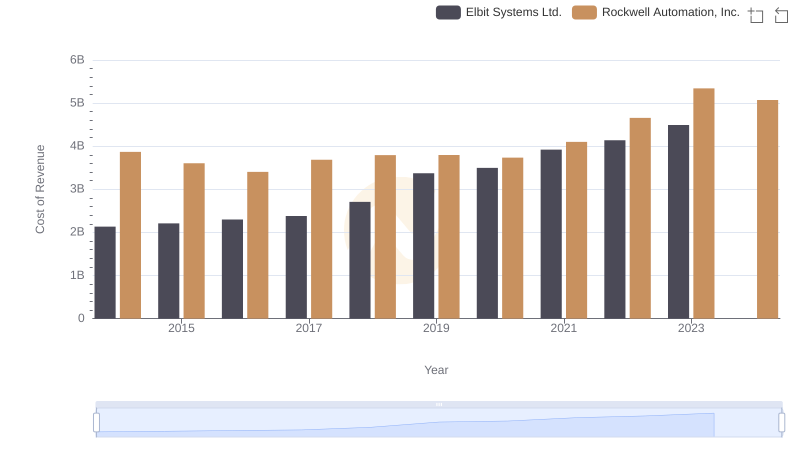
Cost Insights: Breaking Down Rockwell Automation, Inc. and Elbit Systems Ltd.'s Expenses
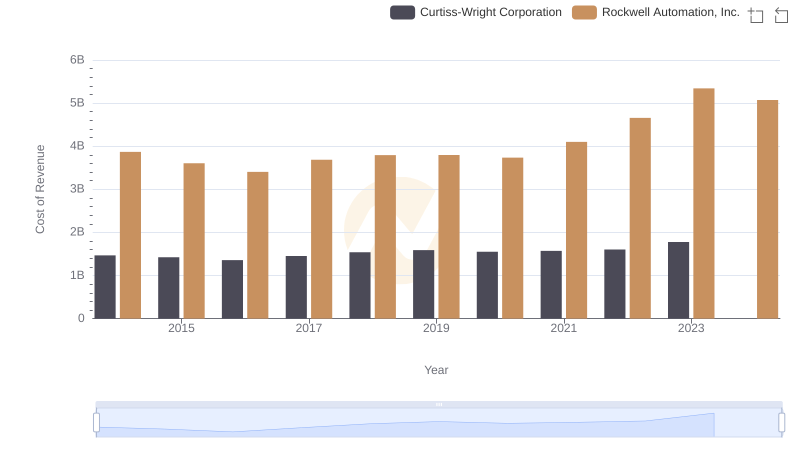
Cost of Revenue Trends: Rockwell Automation, Inc. vs Curtiss-Wright Corporation
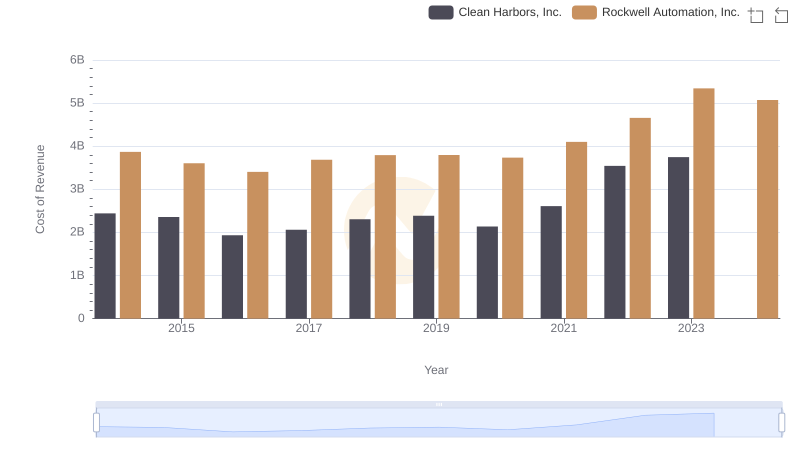
Comparing Cost of Revenue Efficiency: Rockwell Automation, Inc. vs Clean Harbors, Inc.
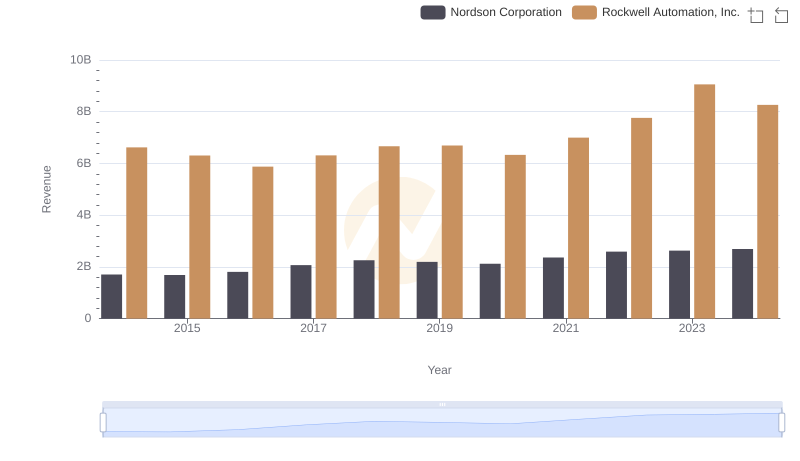
Annual Revenue Comparison: Rockwell Automation, Inc. vs Nordson Corporation
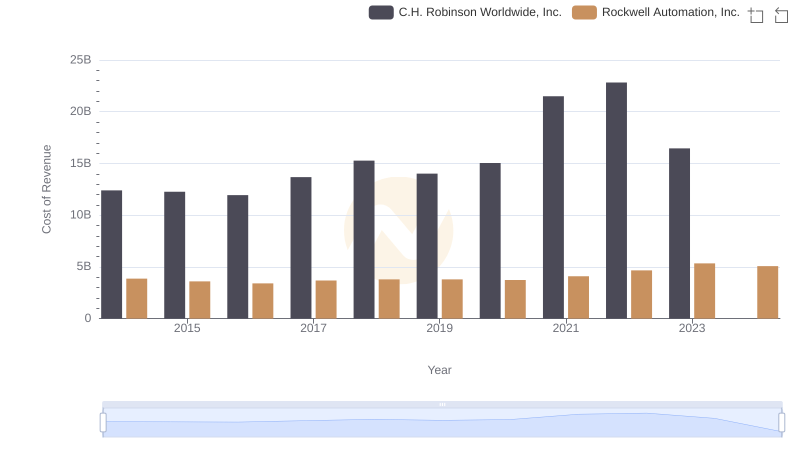
Analyzing Cost of Revenue: Rockwell Automation, Inc. and C.H. Robinson Worldwide, Inc.
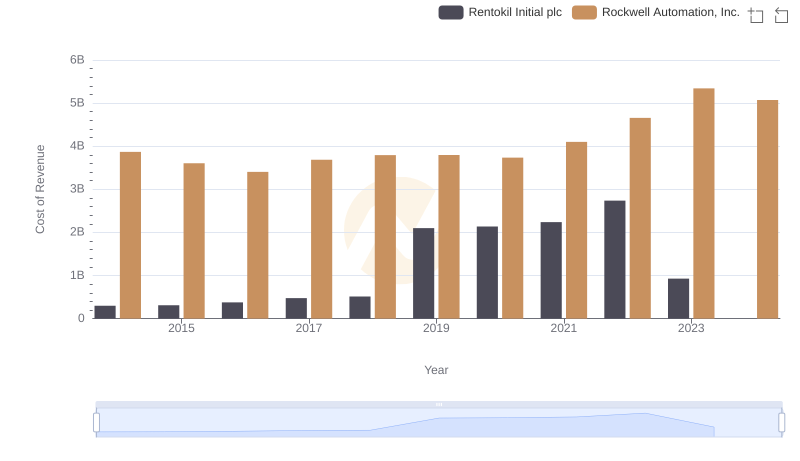
Cost Insights: Breaking Down Rockwell Automation, Inc. and Rentokil Initial plc's Expenses
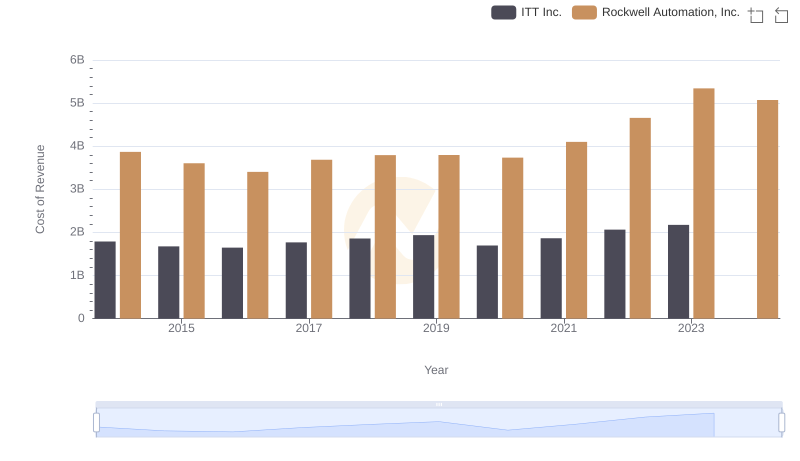
Cost of Revenue Trends: Rockwell Automation, Inc. vs ITT Inc.
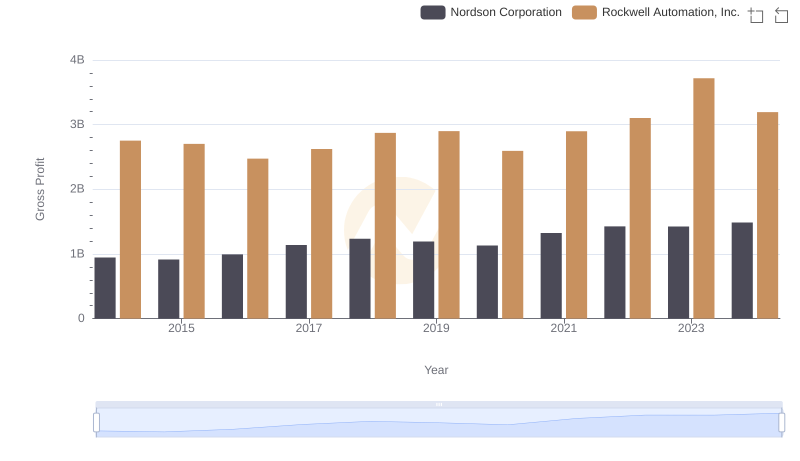
Gross Profit Analysis: Comparing Rockwell Automation, Inc. and Nordson Corporation
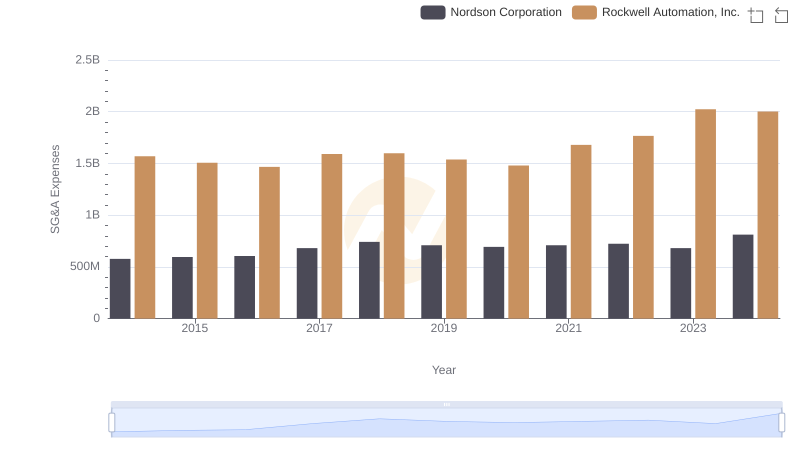
Selling, General, and Administrative Costs: Rockwell Automation, Inc. vs Nordson Corporation