| __timestamp | Nordson Corporation | Rockwell Automation, Inc. |
|---|---|---|
| Wednesday, January 1, 2014 | 945098000 | 2753900000 |
| Thursday, January 1, 2015 | 913964000 | 2703100000 |
| Friday, January 1, 2016 | 993499000 | 2475500000 |
| Sunday, January 1, 2017 | 1139001000 | 2624200000 |
| Monday, January 1, 2018 | 1235965000 | 2872200000 |
| Tuesday, January 1, 2019 | 1192103000 | 2900100000 |
| Wednesday, January 1, 2020 | 1130468000 | 2595200000 |
| Friday, January 1, 2021 | 1324080000 | 2897700000 |
| Saturday, January 1, 2022 | 1426536000 | 3102000000 |
| Sunday, January 1, 2023 | 1425405000 | 3717000000 |
| Monday, January 1, 2024 | 1486129000 | 3193400000 |
In pursuit of knowledge
In the ever-evolving landscape of industrial automation and technology, understanding financial performance is crucial. This analysis delves into the gross profit trends of two industry giants: Rockwell Automation, Inc. and Nordson Corporation, from 2014 to 2024.
Rockwell Automation consistently outperformed Nordson Corporation in terms of gross profit, with an average of approximately $2.9 billion annually, nearly double Nordson's average of $1.2 billion. Notably, Rockwell's gross profit peaked in 2023, reaching a remarkable $3.7 billion, a 35% increase from 2016. Meanwhile, Nordson showed steady growth, achieving a 50% increase in gross profit from 2014 to 2024.
These trends highlight Rockwell's dominant market position and Nordson's consistent growth trajectory. Investors and industry analysts should consider these insights when evaluating the financial health and strategic direction of these companies.
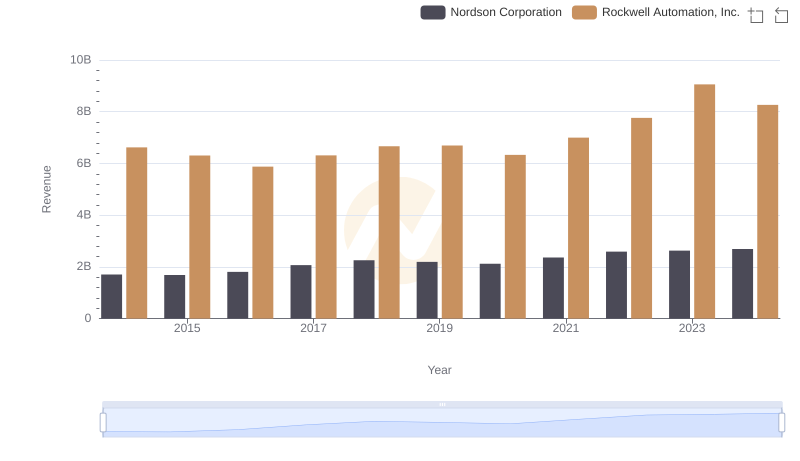
Annual Revenue Comparison: Rockwell Automation, Inc. vs Nordson Corporation
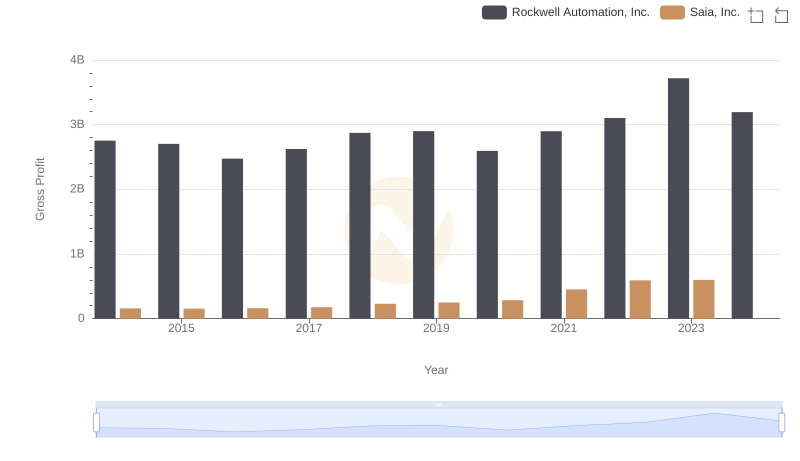
Key Insights on Gross Profit: Rockwell Automation, Inc. vs Saia, Inc.
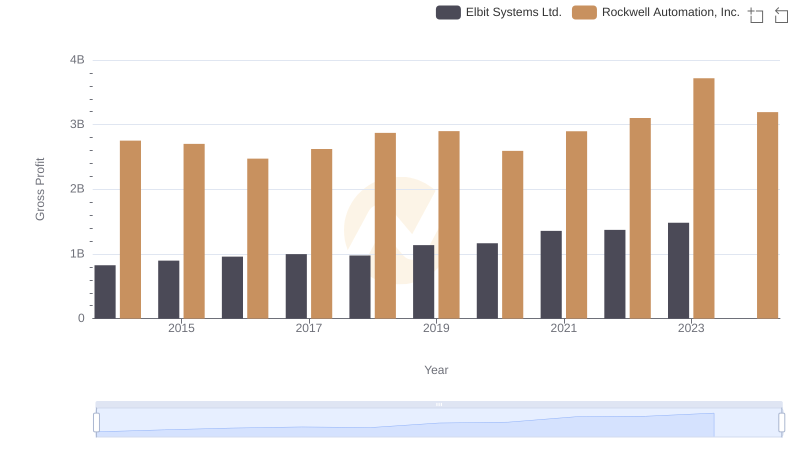
Rockwell Automation, Inc. vs Elbit Systems Ltd.: A Gross Profit Performance Breakdown
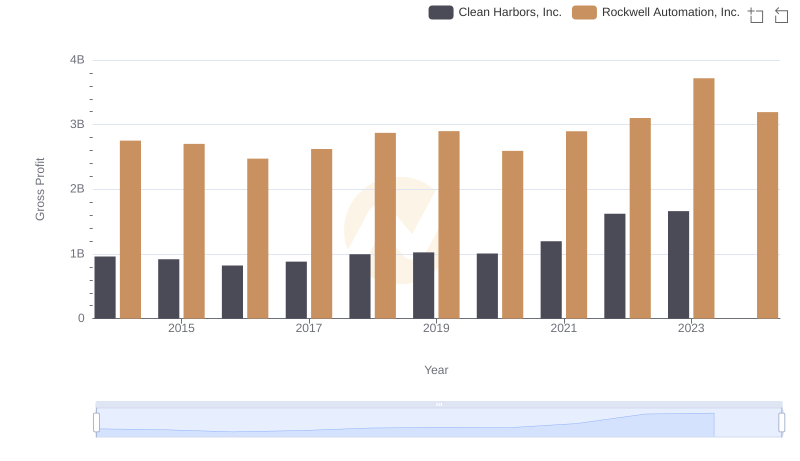
Rockwell Automation, Inc. vs Clean Harbors, Inc.: A Gross Profit Performance Breakdown
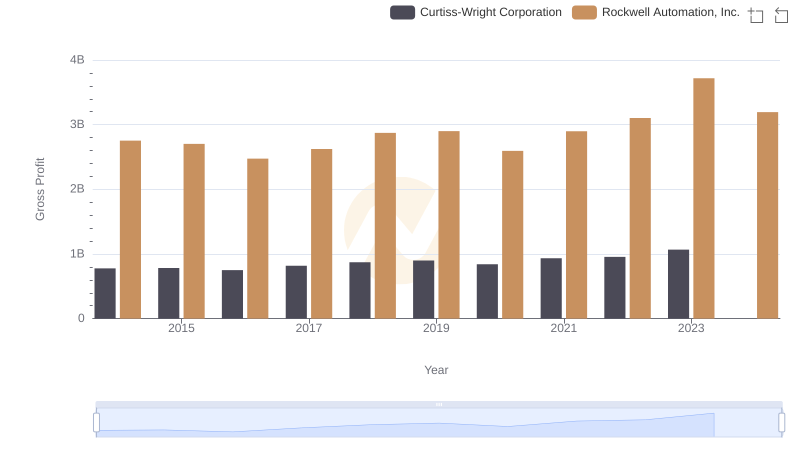
Rockwell Automation, Inc. and Curtiss-Wright Corporation: A Detailed Gross Profit Analysis
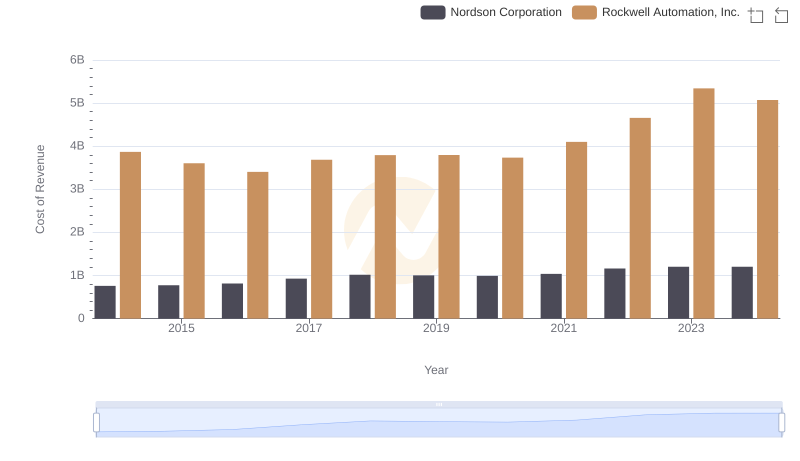
Analyzing Cost of Revenue: Rockwell Automation, Inc. and Nordson Corporation
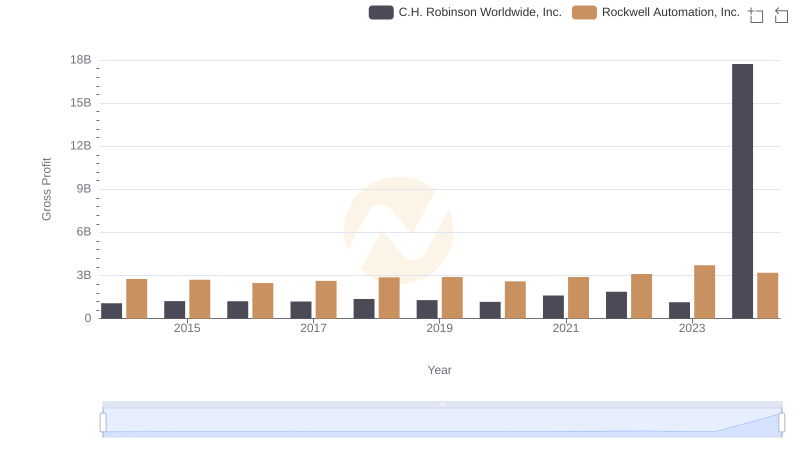
Key Insights on Gross Profit: Rockwell Automation, Inc. vs C.H. Robinson Worldwide, Inc.
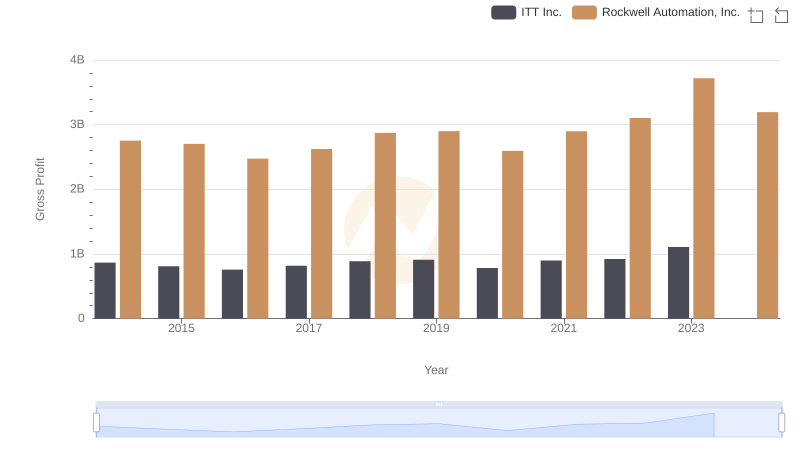
Gross Profit Comparison: Rockwell Automation, Inc. and ITT Inc. Trends
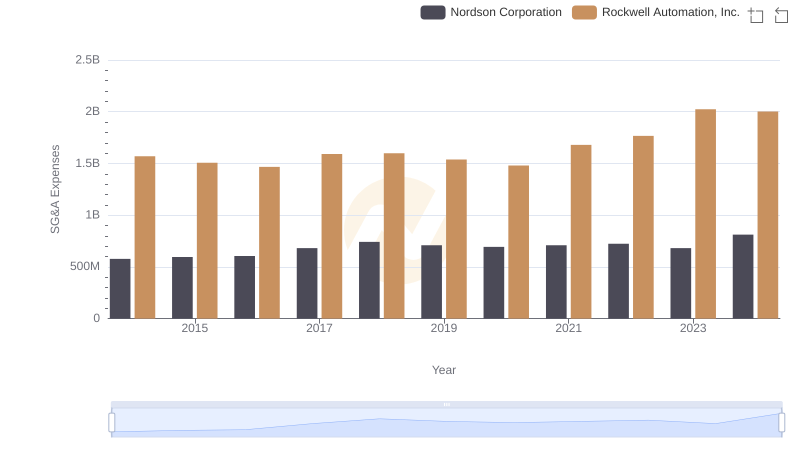
Selling, General, and Administrative Costs: Rockwell Automation, Inc. vs Nordson Corporation