| __timestamp | C.H. Robinson Worldwide, Inc. | Rockwell Automation, Inc. |
|---|---|---|
| Wednesday, January 1, 2014 | 12401436000 | 3869600000 |
| Thursday, January 1, 2015 | 12259014000 | 3604800000 |
| Friday, January 1, 2016 | 11931821000 | 3404000000 |
| Sunday, January 1, 2017 | 13680857000 | 3687100000 |
| Monday, January 1, 2018 | 15269479000 | 3793800000 |
| Tuesday, January 1, 2019 | 14021726000 | 3794700000 |
| Wednesday, January 1, 2020 | 15037716000 | 3734600000 |
| Friday, January 1, 2021 | 21493659000 | 4099700000 |
| Saturday, January 1, 2022 | 22826428000 | 4658400000 |
| Sunday, January 1, 2023 | 16457570000 | 5341000000 |
| Monday, January 1, 2024 | 16416191000 | 5070800000 |
Igniting the spark of knowledge
In the ever-evolving landscape of industrial automation and logistics, Rockwell Automation, Inc. and C.H. Robinson Worldwide, Inc. stand as titans. Over the past decade, these companies have navigated the complexities of cost management with varying strategies. From 2014 to 2023, C.H. Robinson's cost of revenue surged by approximately 33%, peaking in 2022, reflecting the global supply chain challenges. Meanwhile, Rockwell Automation exhibited a steady growth of around 38% in the same period, showcasing resilience in automation technology.
This analysis underscores the dynamic nature of cost management in these industries, highlighting the strategic adaptations of these market leaders.
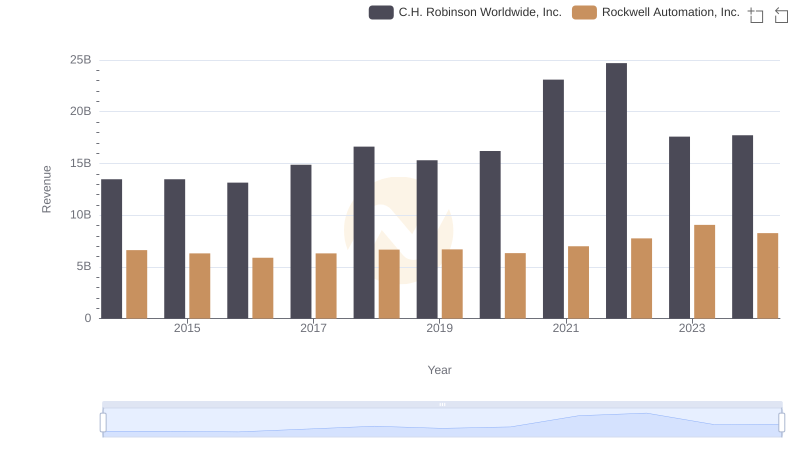
Rockwell Automation, Inc. vs C.H. Robinson Worldwide, Inc.: Annual Revenue Growth Compared
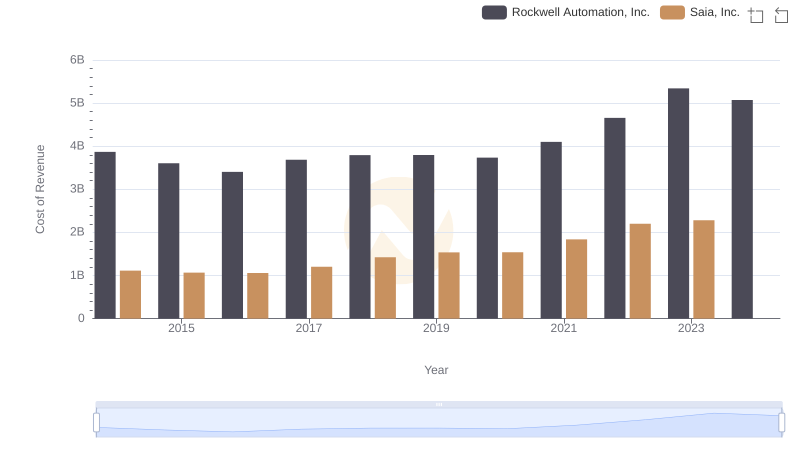
Cost of Revenue Comparison: Rockwell Automation, Inc. vs Saia, Inc.
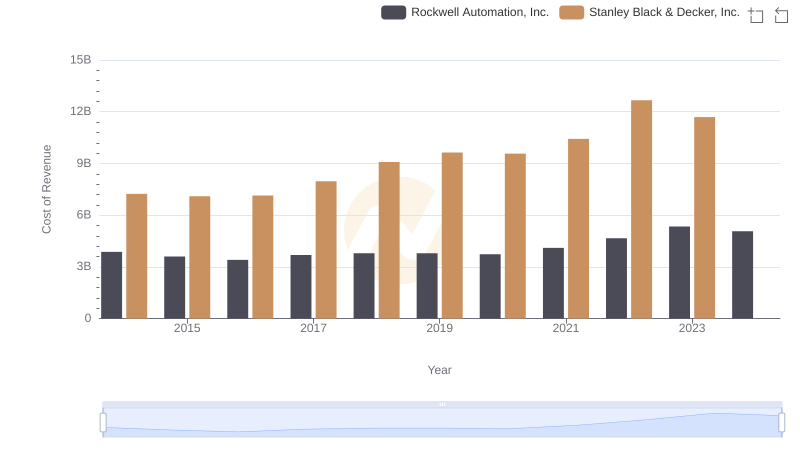
Rockwell Automation, Inc. vs Stanley Black & Decker, Inc.: Efficiency in Cost of Revenue Explored
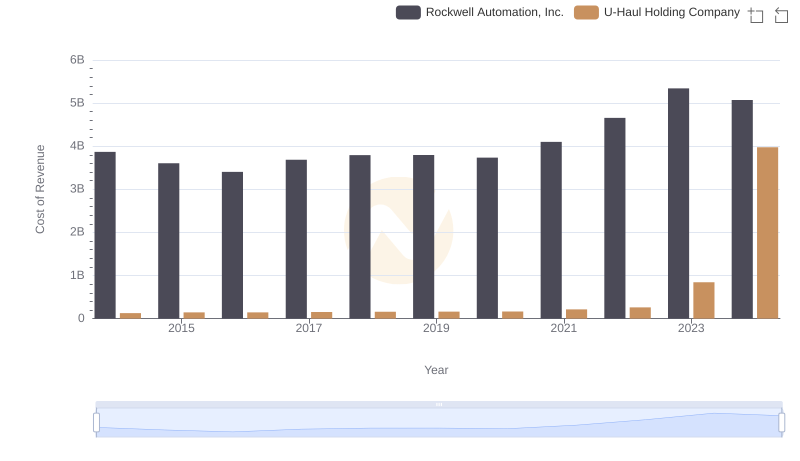
Analyzing Cost of Revenue: Rockwell Automation, Inc. and U-Haul Holding Company
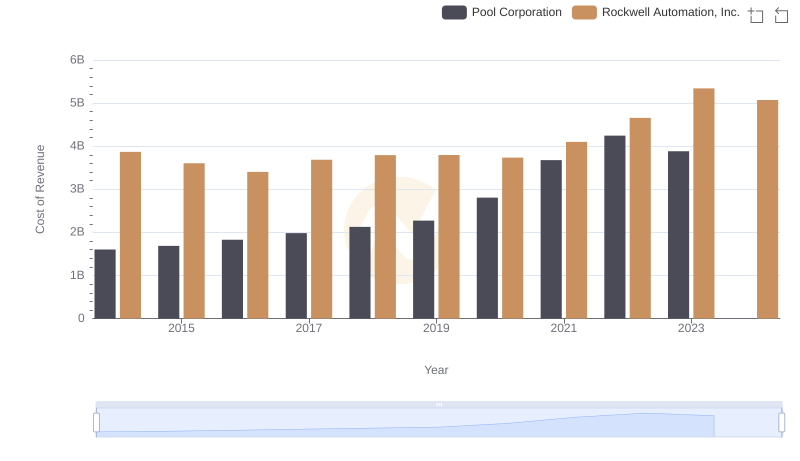
Analyzing Cost of Revenue: Rockwell Automation, Inc. and Pool Corporation
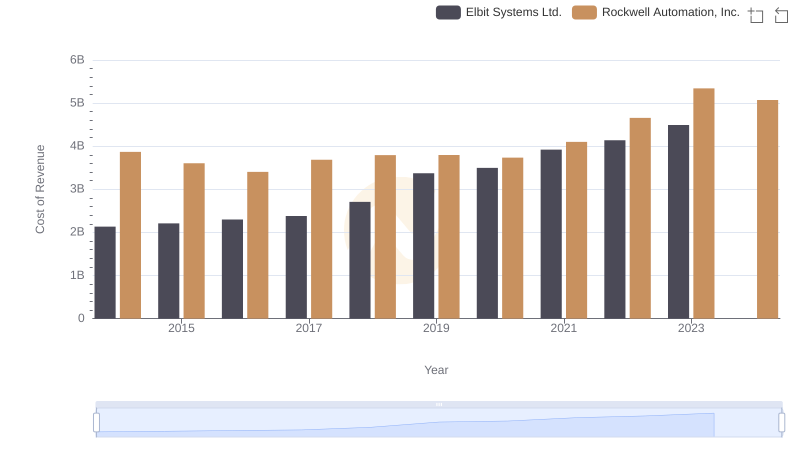
Cost Insights: Breaking Down Rockwell Automation, Inc. and Elbit Systems Ltd.'s Expenses
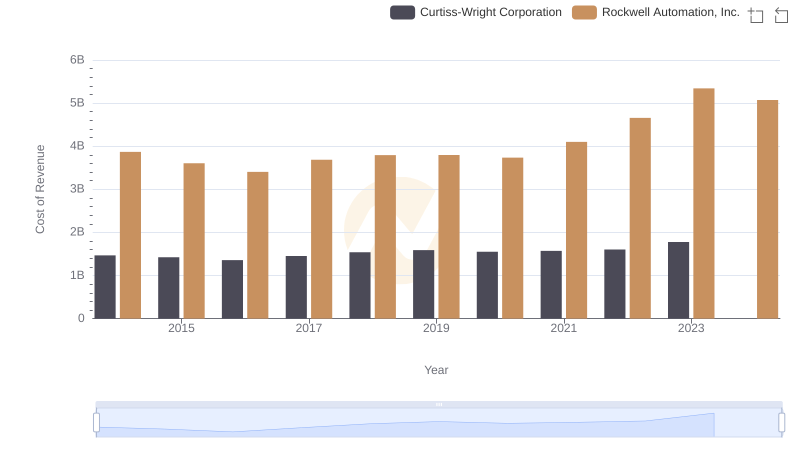
Cost of Revenue Trends: Rockwell Automation, Inc. vs Curtiss-Wright Corporation
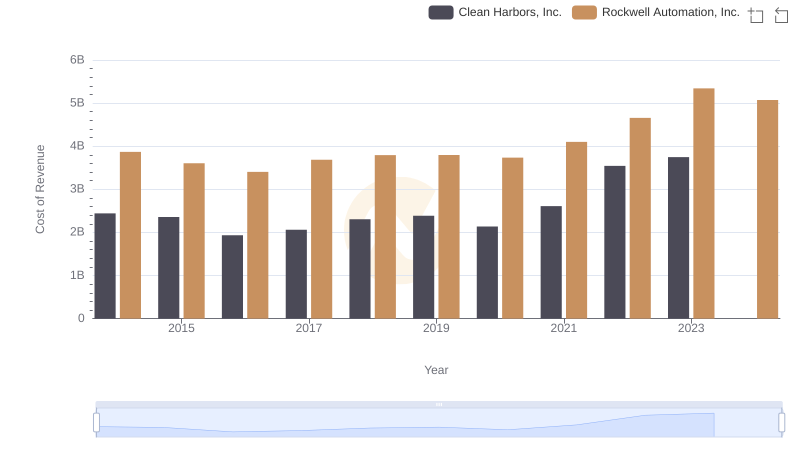
Comparing Cost of Revenue Efficiency: Rockwell Automation, Inc. vs Clean Harbors, Inc.
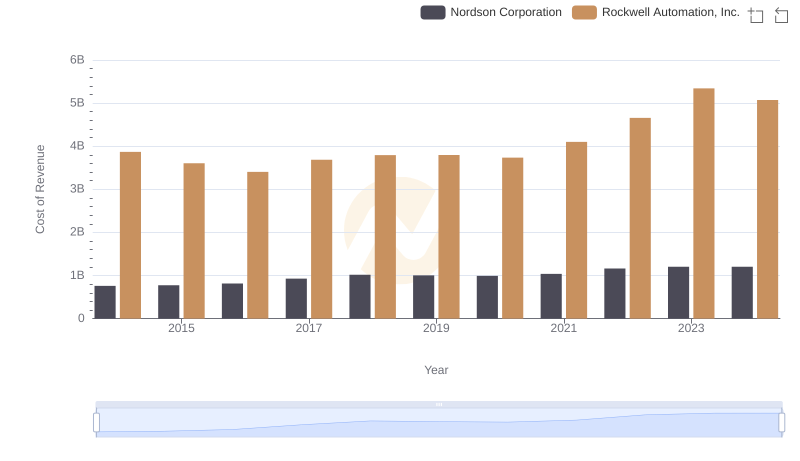
Analyzing Cost of Revenue: Rockwell Automation, Inc. and Nordson Corporation
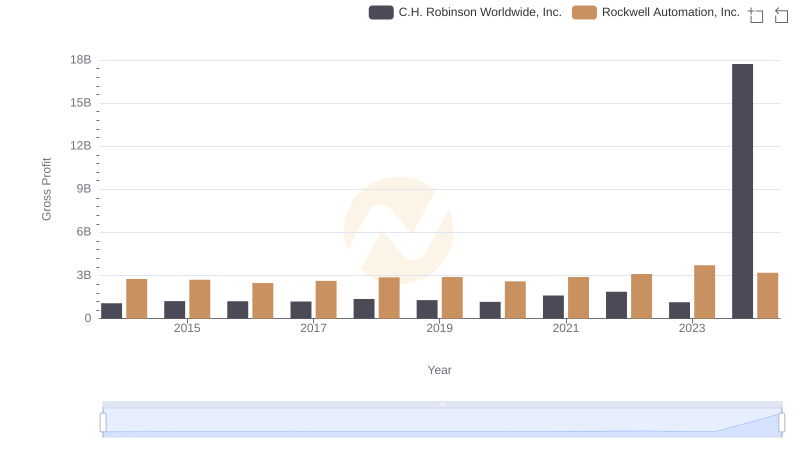
Key Insights on Gross Profit: Rockwell Automation, Inc. vs C.H. Robinson Worldwide, Inc.
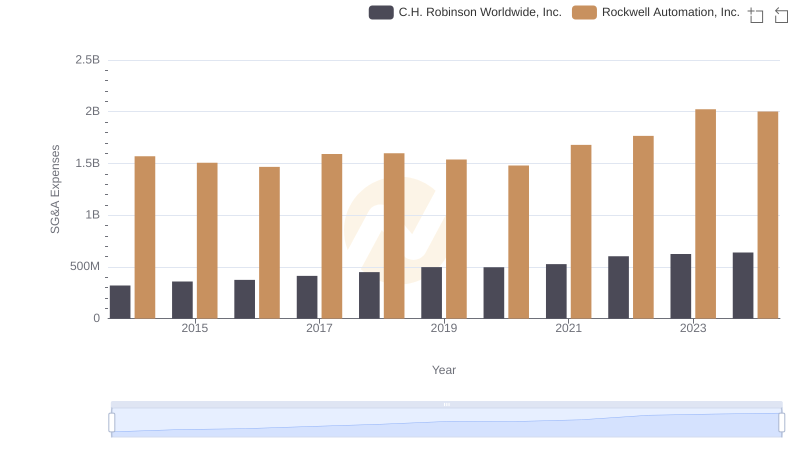
Cost Management Insights: SG&A Expenses for Rockwell Automation, Inc. and C.H. Robinson Worldwide, Inc.
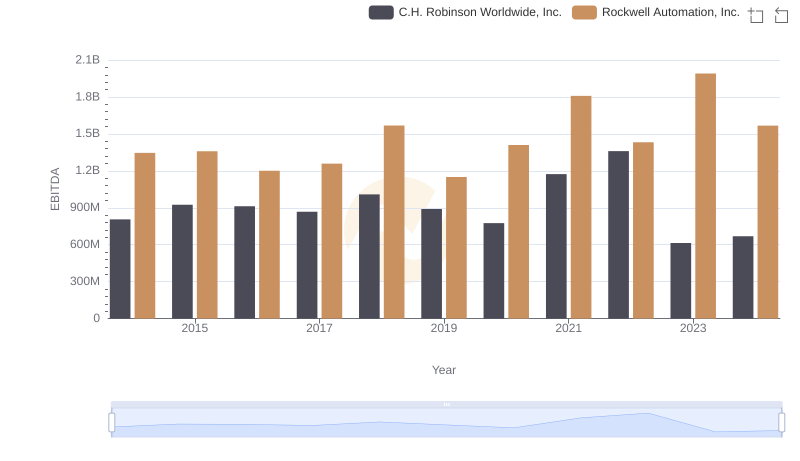
Rockwell Automation, Inc. and C.H. Robinson Worldwide, Inc.: A Detailed Examination of EBITDA Performance