| __timestamp | Nordson Corporation | Rockwell Automation, Inc. |
|---|---|---|
| Wednesday, January 1, 2014 | 1704021000 | 6623500000 |
| Thursday, January 1, 2015 | 1688666000 | 6307900000 |
| Friday, January 1, 2016 | 1808994000 | 5879500000 |
| Sunday, January 1, 2017 | 2066982000 | 6311300000 |
| Monday, January 1, 2018 | 2254668000 | 6666000000 |
| Tuesday, January 1, 2019 | 2194226000 | 6694800000 |
| Wednesday, January 1, 2020 | 2121100000 | 6329800000 |
| Friday, January 1, 2021 | 2362209000 | 6997400000 |
| Saturday, January 1, 2022 | 2590278000 | 7760400000 |
| Sunday, January 1, 2023 | 2628632000 | 9058000000 |
| Monday, January 1, 2024 | 2689921000 | 8264200000 |
Unlocking the unknown
In the ever-evolving landscape of industrial automation, Rockwell Automation, Inc. and Nordson Corporation have been pivotal players. Over the past decade, from 2014 to 2023, Rockwell Automation has consistently outperformed Nordson in terms of annual revenue. In 2023, Rockwell's revenue peaked at approximately $9.06 billion, marking a 37% increase from 2014. Meanwhile, Nordson's revenue grew by 54% over the same period, reaching around $2.63 billion in 2023.
Despite the disparity in absolute figures, Nordson's growth trajectory is noteworthy, reflecting its strategic expansions and market adaptability. Rockwell's dominance, however, underscores its robust market presence and innovation leadership. As we look to 2024, with Nordson projected to reach $2.69 billion and Rockwell slightly declining to $8.26 billion, the competitive dynamics in industrial automation continue to captivate industry watchers.
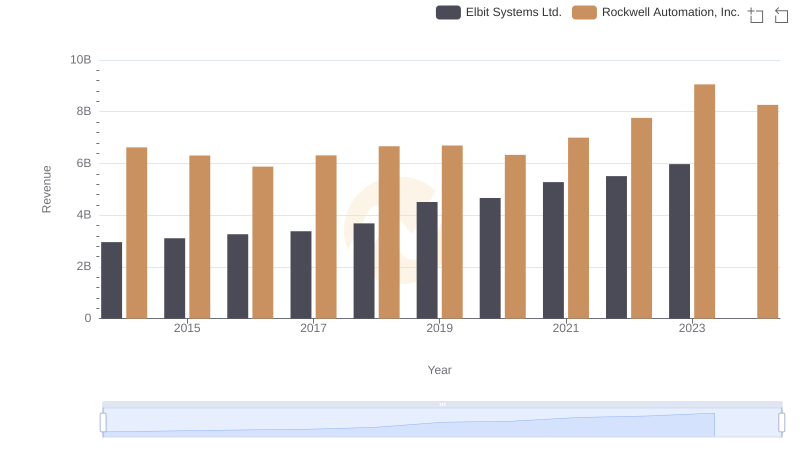
Revenue Showdown: Rockwell Automation, Inc. vs Elbit Systems Ltd.

Breaking Down Revenue Trends: Rockwell Automation, Inc. vs Curtiss-Wright Corporation
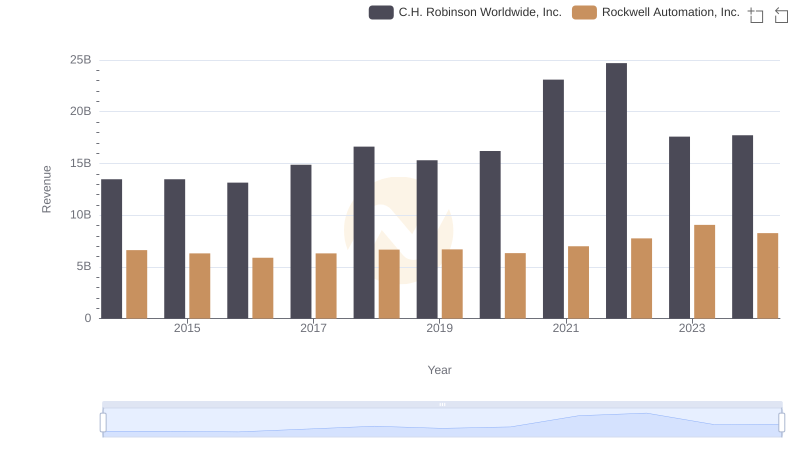
Rockwell Automation, Inc. vs C.H. Robinson Worldwide, Inc.: Annual Revenue Growth Compared
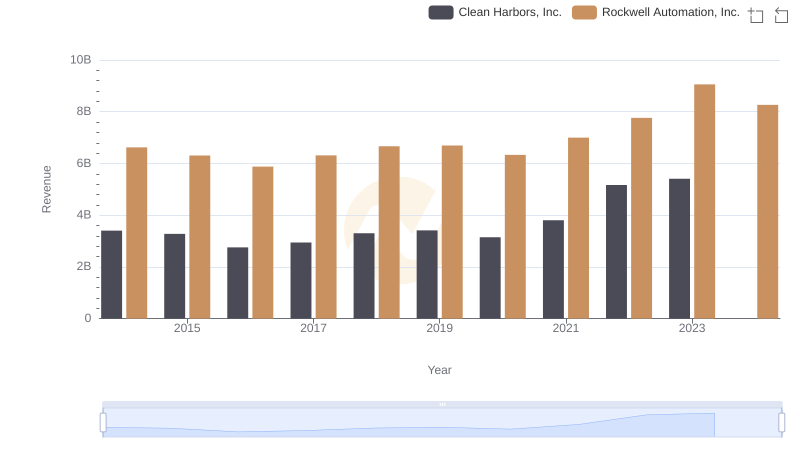
Comparing Revenue Performance: Rockwell Automation, Inc. or Clean Harbors, Inc.?
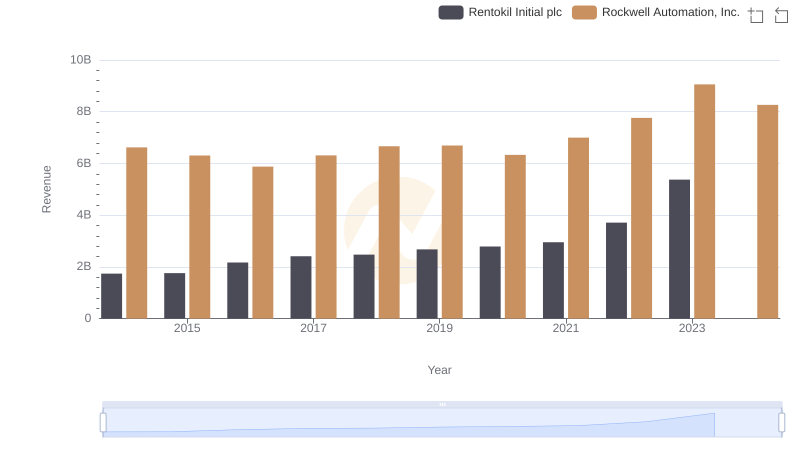
Rockwell Automation, Inc. vs Rentokil Initial plc: Examining Key Revenue Metrics
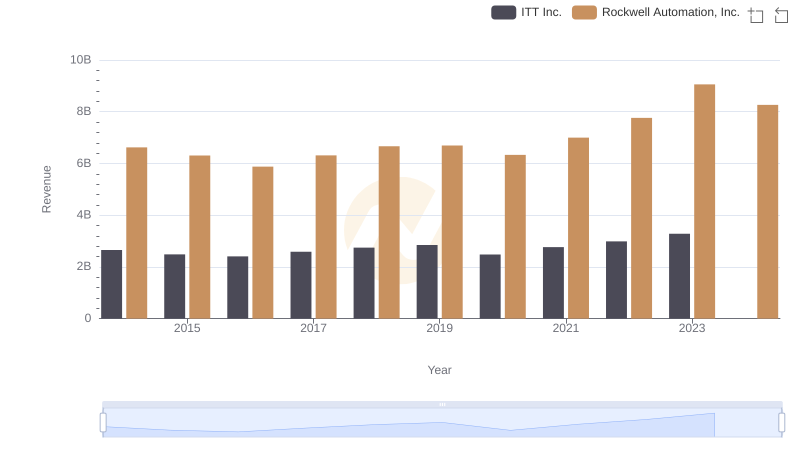
Comparing Revenue Performance: Rockwell Automation, Inc. or ITT Inc.?
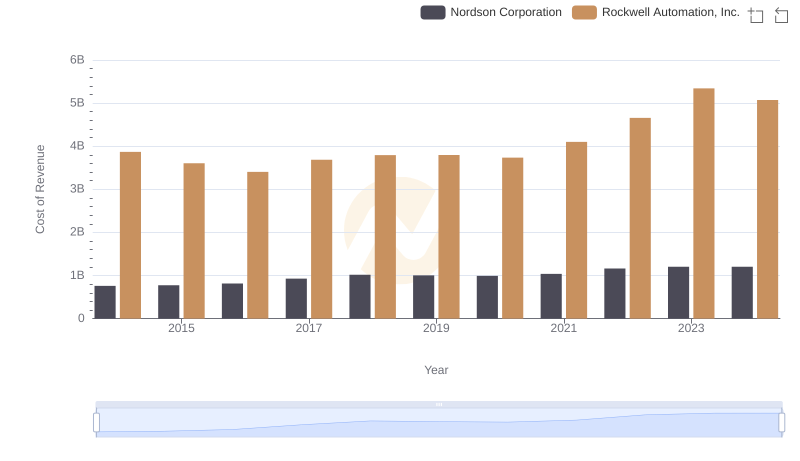
Analyzing Cost of Revenue: Rockwell Automation, Inc. and Nordson Corporation
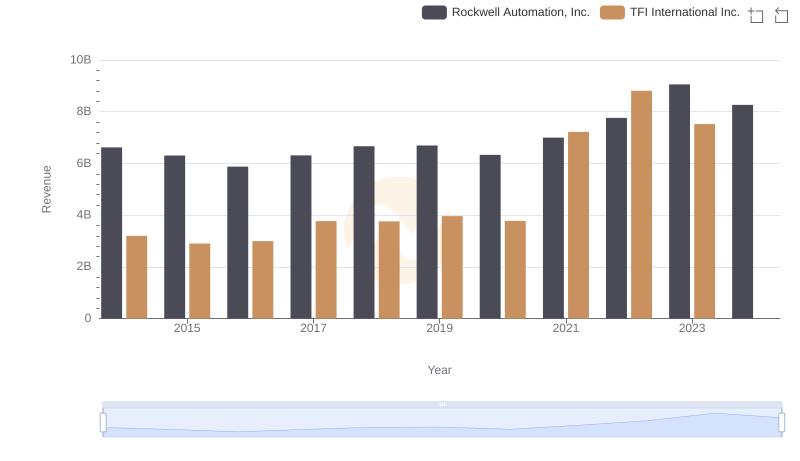
Breaking Down Revenue Trends: Rockwell Automation, Inc. vs TFI International Inc.
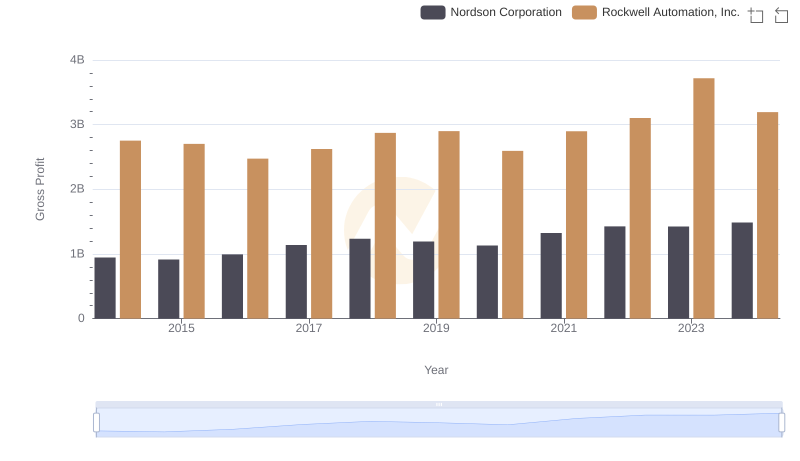
Gross Profit Analysis: Comparing Rockwell Automation, Inc. and Nordson Corporation
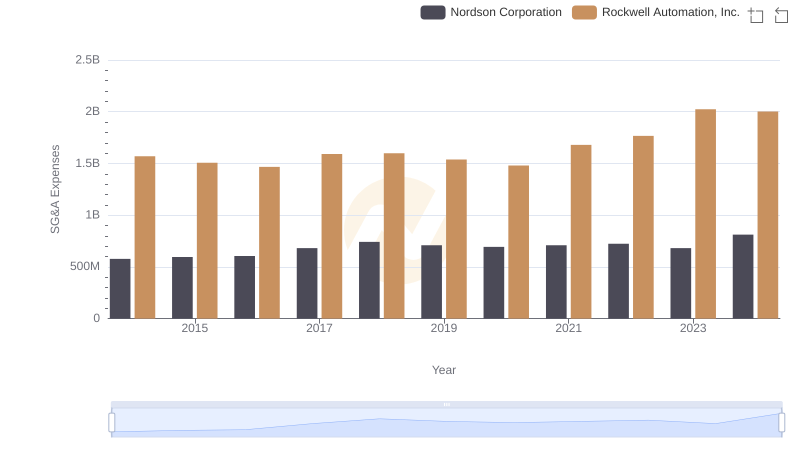
Selling, General, and Administrative Costs: Rockwell Automation, Inc. vs Nordson Corporation