| __timestamp | Nordson Corporation | Rockwell Automation, Inc. |
|---|---|---|
| Wednesday, January 1, 2014 | 577993000 | 1570100000 |
| Thursday, January 1, 2015 | 596234000 | 1506400000 |
| Friday, January 1, 2016 | 605068000 | 1467400000 |
| Sunday, January 1, 2017 | 681299000 | 1591500000 |
| Monday, January 1, 2018 | 741408000 | 1599000000 |
| Tuesday, January 1, 2019 | 708990000 | 1538500000 |
| Wednesday, January 1, 2020 | 693552000 | 1479800000 |
| Friday, January 1, 2021 | 708953000 | 1680000000 |
| Saturday, January 1, 2022 | 724176000 | 1766700000 |
| Sunday, January 1, 2023 | 681244000 | 2023700000 |
| Monday, January 1, 2024 | 812128000 | 2002600000 |
In pursuit of knowledge
In the ever-evolving landscape of industrial automation and manufacturing, understanding the financial dynamics of key players is crucial. This analysis delves into the Selling, General, and Administrative (SG&A) expenses of Rockwell Automation, Inc. and Nordson Corporation from 2014 to 2024. Over this decade, Rockwell Automation consistently outpaced Nordson in SG&A spending, with a peak in 2023, reaching nearly 2 billion USD. This represents a 29% increase from 2014. In contrast, Nordson's SG&A expenses grew by approximately 40% over the same period, peaking in 2024. These trends reflect strategic investments in operational efficiency and market expansion. As the industry continues to innovate, monitoring these financial metrics offers valuable insights into corporate strategies and market positioning.
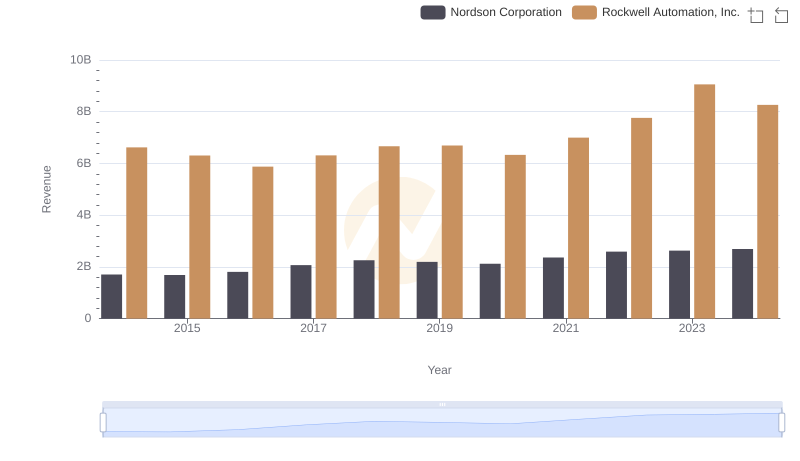
Annual Revenue Comparison: Rockwell Automation, Inc. vs Nordson Corporation
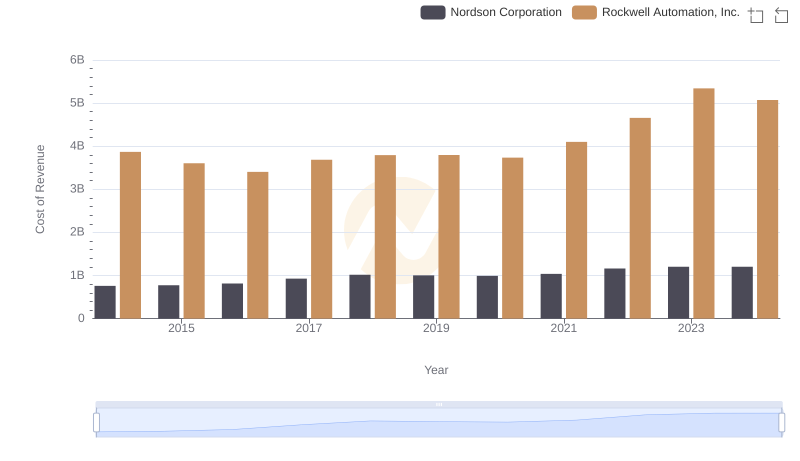
Analyzing Cost of Revenue: Rockwell Automation, Inc. and Nordson Corporation

Who Optimizes SG&A Costs Better? Rockwell Automation, Inc. or Stanley Black & Decker, Inc.
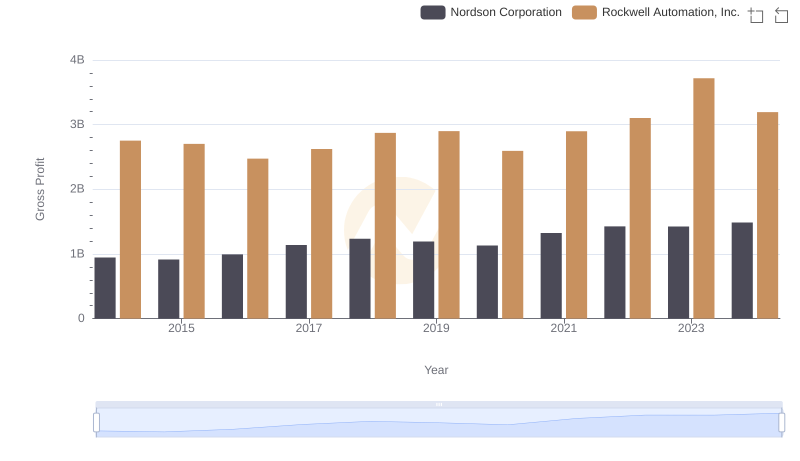
Gross Profit Analysis: Comparing Rockwell Automation, Inc. and Nordson Corporation
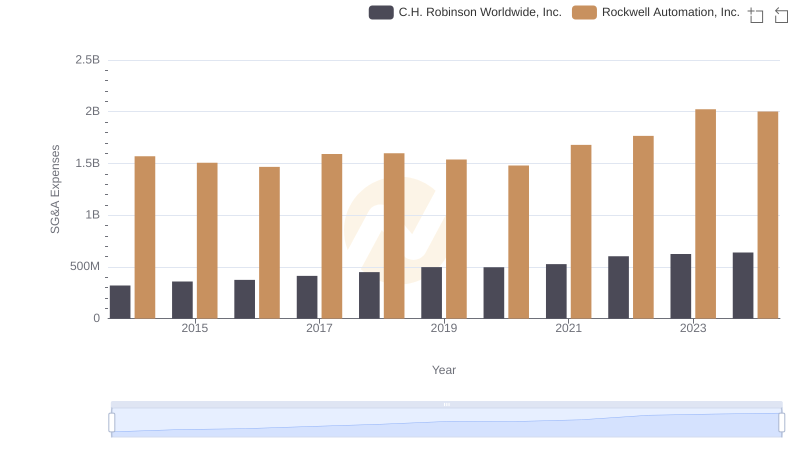
Cost Management Insights: SG&A Expenses for Rockwell Automation, Inc. and C.H. Robinson Worldwide, Inc.
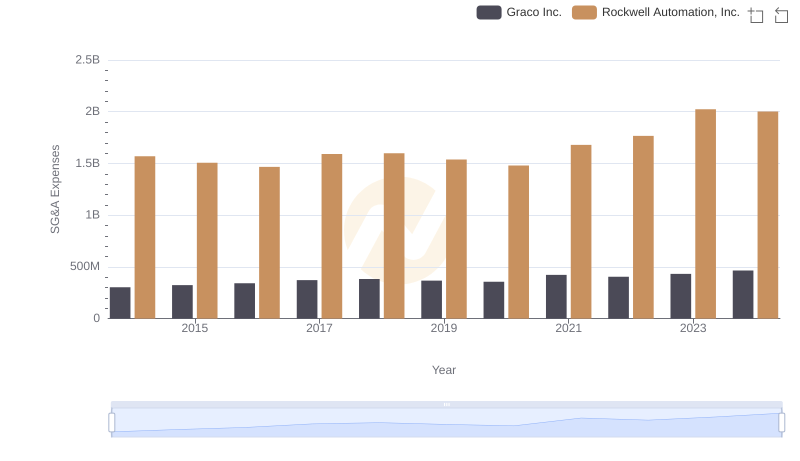
Rockwell Automation, Inc. and Graco Inc.: SG&A Spending Patterns Compared
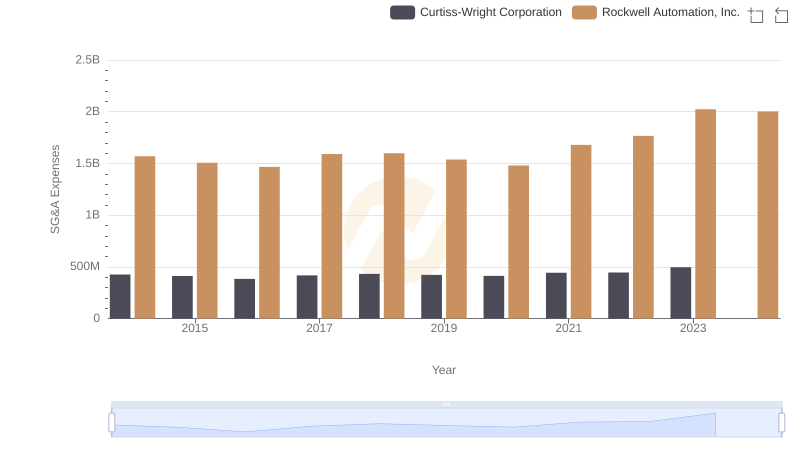
Comparing SG&A Expenses: Rockwell Automation, Inc. vs Curtiss-Wright Corporation Trends and Insights