| __timestamp | Rentokil Initial plc | Rockwell Automation, Inc. |
|---|---|---|
| Wednesday, January 1, 2014 | 297500000 | 3869600000 |
| Thursday, January 1, 2015 | 310200000 | 3604800000 |
| Friday, January 1, 2016 | 376100000 | 3404000000 |
| Sunday, January 1, 2017 | 474900000 | 3687100000 |
| Monday, January 1, 2018 | 514200000 | 3793800000 |
| Tuesday, January 1, 2019 | 2099000000 | 3794700000 |
| Wednesday, January 1, 2020 | 2136400000 | 3734600000 |
| Friday, January 1, 2021 | 2239100000 | 4099700000 |
| Saturday, January 1, 2022 | 2737000000 | 4658400000 |
| Sunday, January 1, 2023 | 927000000 | 5341000000 |
| Monday, January 1, 2024 | 5070800000 |
Infusing magic into the data realm
In the ever-evolving landscape of industrial automation and pest control, understanding cost structures is pivotal. Rockwell Automation, Inc., a leader in industrial automation, and Rentokil Initial plc, a global pest control giant, offer intriguing insights into their financial strategies over the past decade.
From 2014 to 2023, Rockwell Automation consistently maintained a higher cost of revenue, peaking at approximately $5.34 billion in 2023. This represents a 38% increase from its 2014 figures, reflecting its expansive growth and investment in cutting-edge technologies. In contrast, Rentokil Initial's cost of revenue surged by over 800% from 2014 to 2022, before a notable dip in 2023, indicating strategic shifts and market adaptations.
While Rockwell's costs remained relatively stable, Rentokil's fluctuations suggest a dynamic approach to market challenges. Missing data for 2024 hints at ongoing transformations, inviting stakeholders to anticipate future trends.
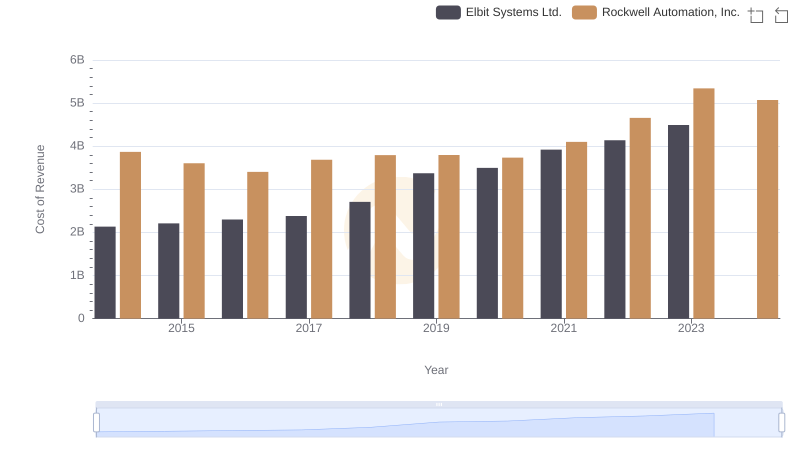
Cost Insights: Breaking Down Rockwell Automation, Inc. and Elbit Systems Ltd.'s Expenses
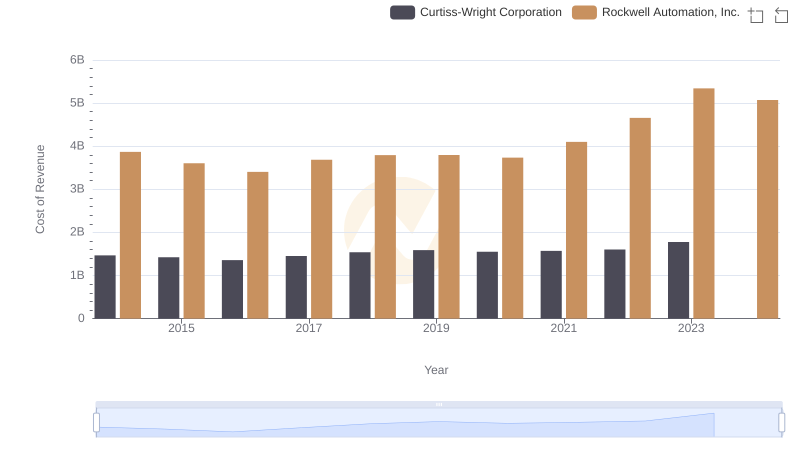
Cost of Revenue Trends: Rockwell Automation, Inc. vs Curtiss-Wright Corporation
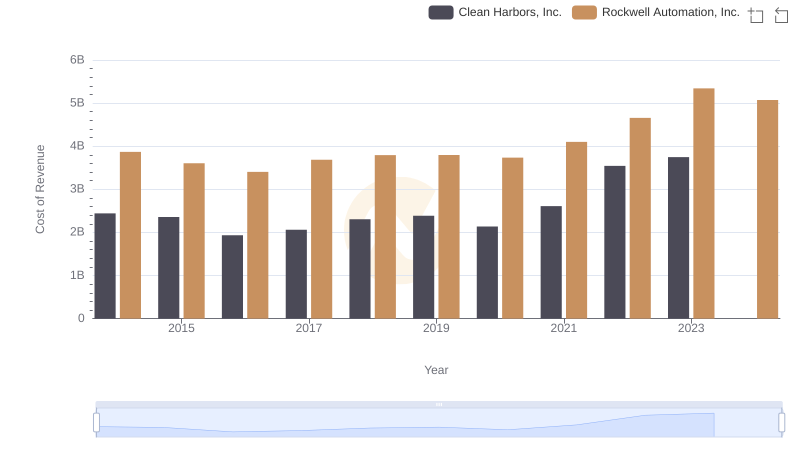
Comparing Cost of Revenue Efficiency: Rockwell Automation, Inc. vs Clean Harbors, Inc.
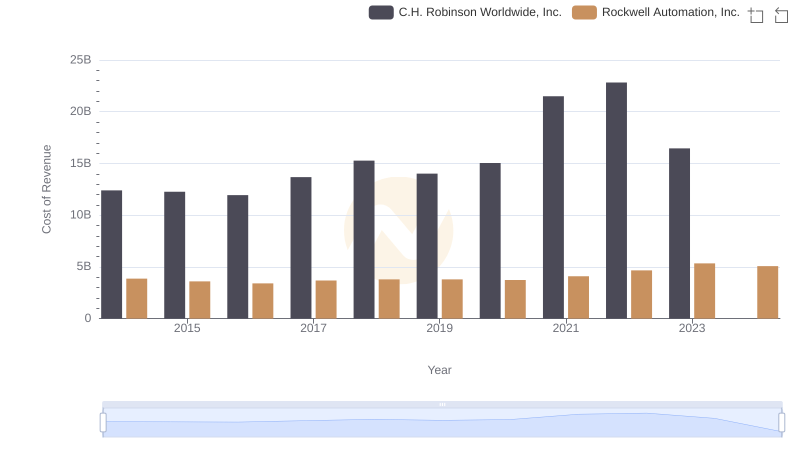
Analyzing Cost of Revenue: Rockwell Automation, Inc. and C.H. Robinson Worldwide, Inc.
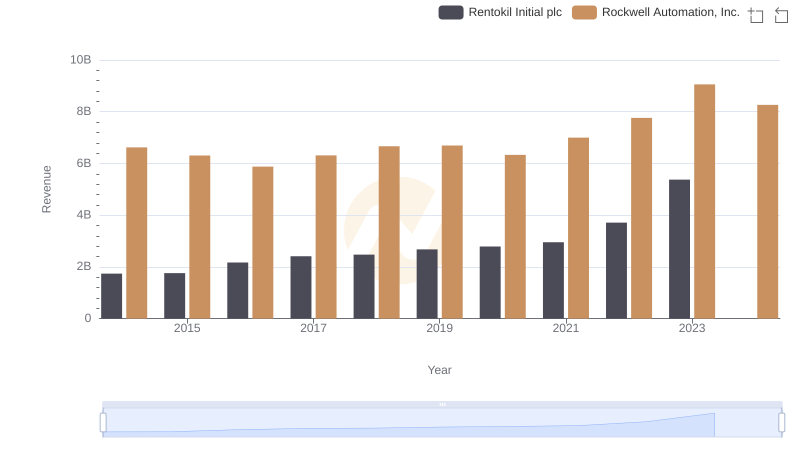
Rockwell Automation, Inc. vs Rentokil Initial plc: Examining Key Revenue Metrics
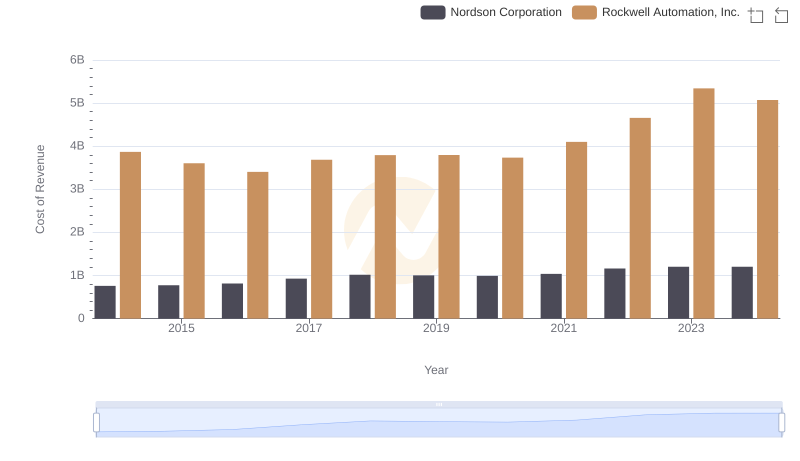
Analyzing Cost of Revenue: Rockwell Automation, Inc. and Nordson Corporation
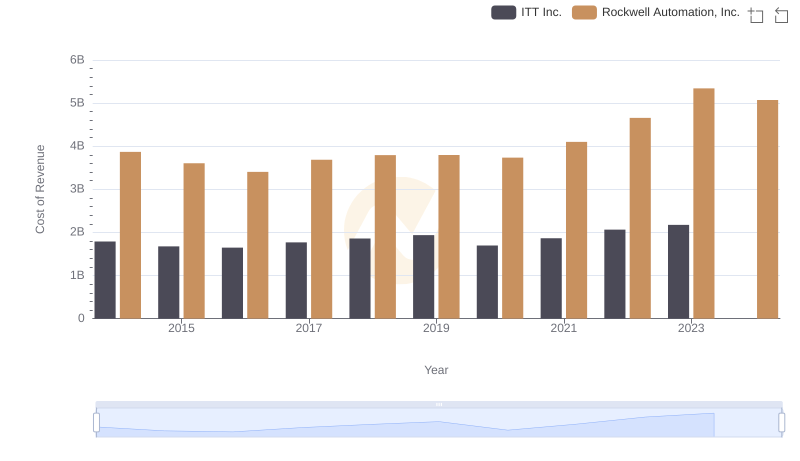
Cost of Revenue Trends: Rockwell Automation, Inc. vs ITT Inc.
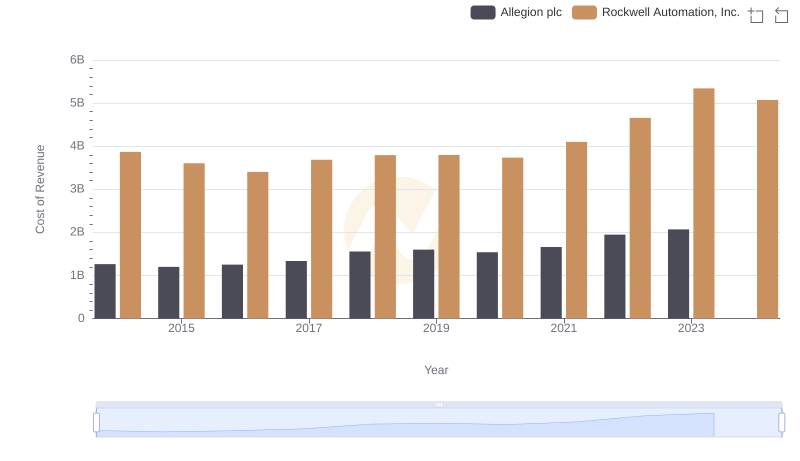
Cost of Revenue Comparison: Rockwell Automation, Inc. vs Allegion plc
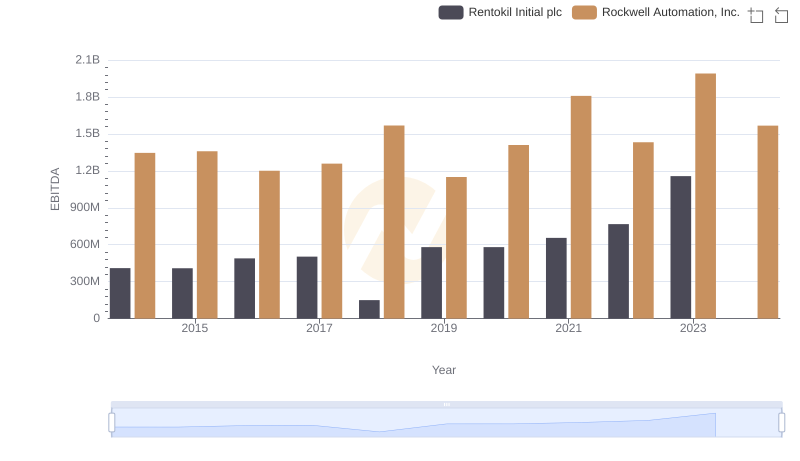
EBITDA Metrics Evaluated: Rockwell Automation, Inc. vs Rentokil Initial plc