| __timestamp | ITT Inc. | Rockwell Automation, Inc. |
|---|---|---|
| Wednesday, January 1, 2014 | 1788200000 | 3869600000 |
| Thursday, January 1, 2015 | 1676500000 | 3604800000 |
| Friday, January 1, 2016 | 1647200000 | 3404000000 |
| Sunday, January 1, 2017 | 1768100000 | 3687100000 |
| Monday, January 1, 2018 | 1857900000 | 3793800000 |
| Tuesday, January 1, 2019 | 1936300000 | 3794700000 |
| Wednesday, January 1, 2020 | 1695600000 | 3734600000 |
| Friday, January 1, 2021 | 1865500000 | 4099700000 |
| Saturday, January 1, 2022 | 2065400000 | 4658400000 |
| Sunday, January 1, 2023 | 2175700000 | 5341000000 |
| Monday, January 1, 2024 | 2383400000 | 5070800000 |
Infusing magic into the data realm
In the ever-evolving landscape of industrial automation and engineering, understanding cost dynamics is crucial. From 2014 to 2023, Rockwell Automation, Inc. and ITT Inc. have shown distinct trends in their cost of revenue. Rockwell Automation, Inc. has seen a steady increase, with a notable 38% rise from 2014 to 2023, peaking at approximately $5.34 billion in 2023. In contrast, ITT Inc. experienced a more modest growth of around 22% over the same period, reaching about $2.18 billion in 2023. This divergence highlights Rockwell's aggressive expansion and investment in technology, while ITT maintains a more conservative approach. The data for 2024 shows a missing value for ITT Inc., indicating potential reporting delays or strategic shifts. These insights provide a window into the strategic priorities and market positioning of these industrial giants.
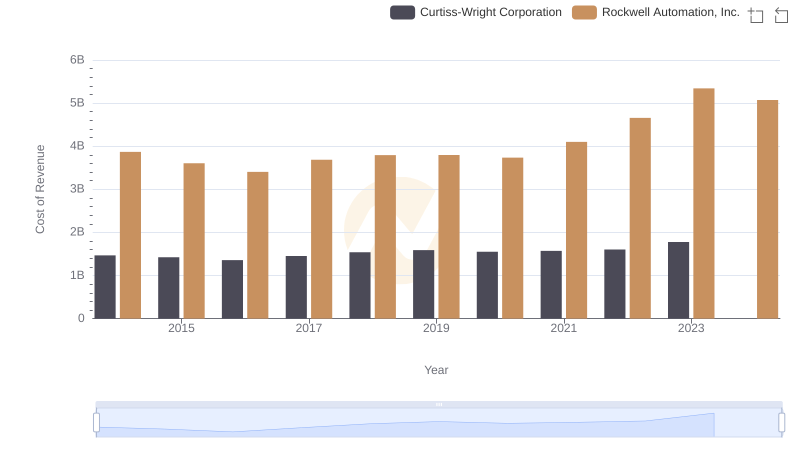
Cost of Revenue Trends: Rockwell Automation, Inc. vs Curtiss-Wright Corporation
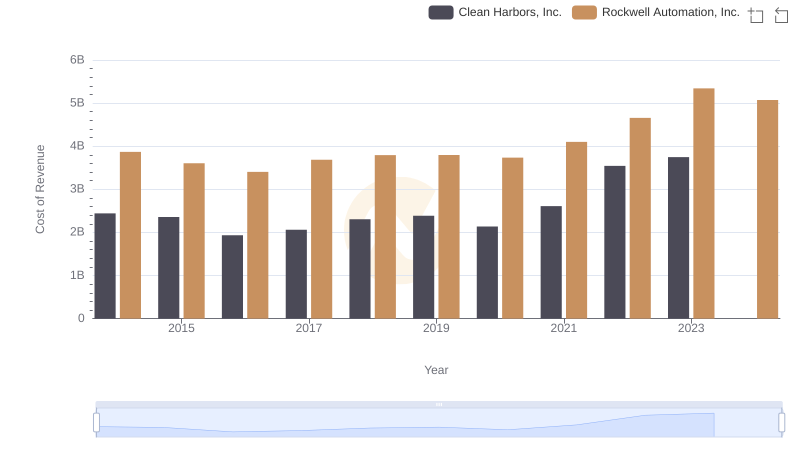
Comparing Cost of Revenue Efficiency: Rockwell Automation, Inc. vs Clean Harbors, Inc.
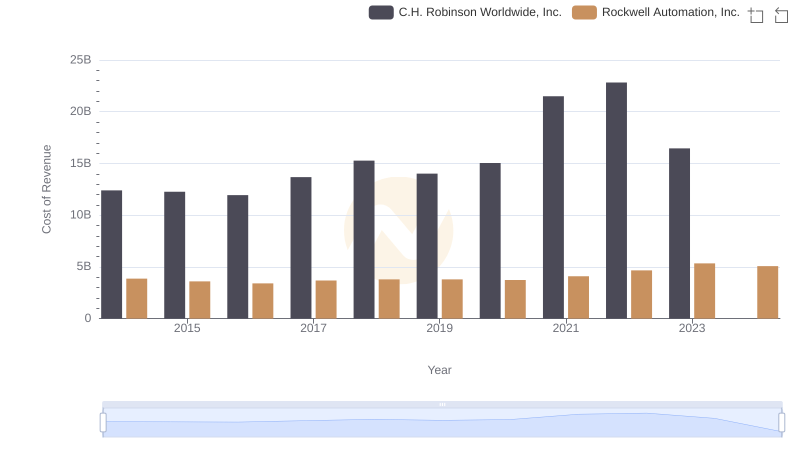
Analyzing Cost of Revenue: Rockwell Automation, Inc. and C.H. Robinson Worldwide, Inc.
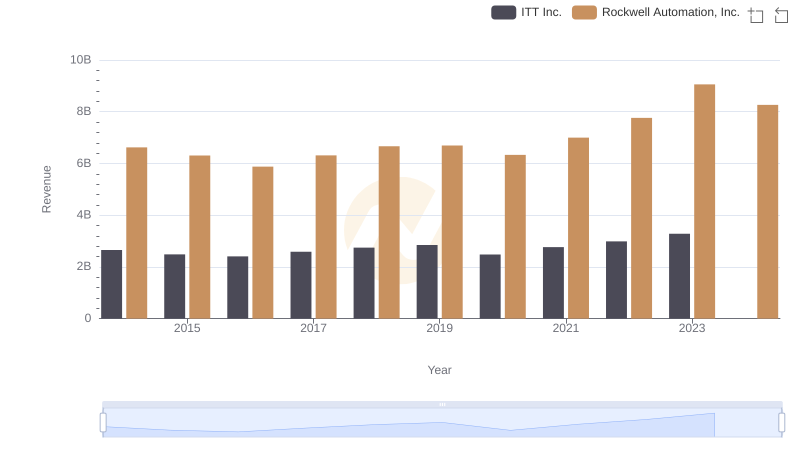
Comparing Revenue Performance: Rockwell Automation, Inc. or ITT Inc.?
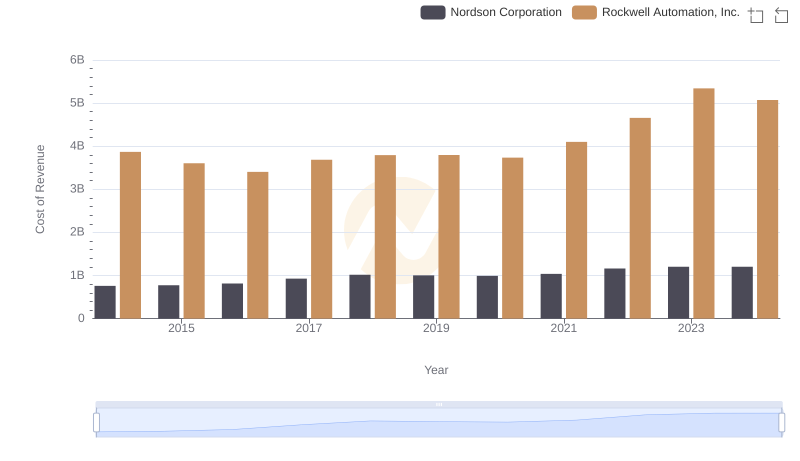
Analyzing Cost of Revenue: Rockwell Automation, Inc. and Nordson Corporation
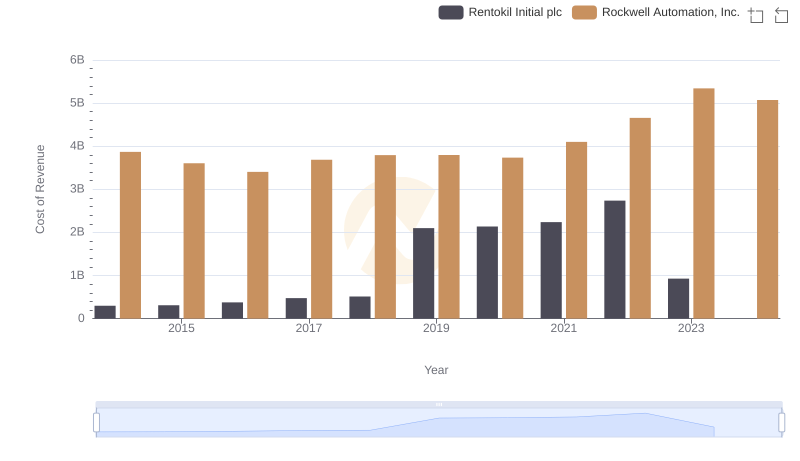
Cost Insights: Breaking Down Rockwell Automation, Inc. and Rentokil Initial plc's Expenses
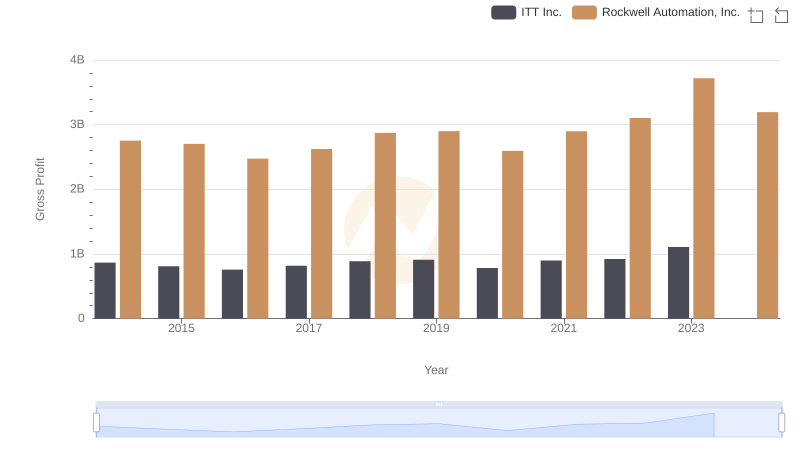
Gross Profit Comparison: Rockwell Automation, Inc. and ITT Inc. Trends
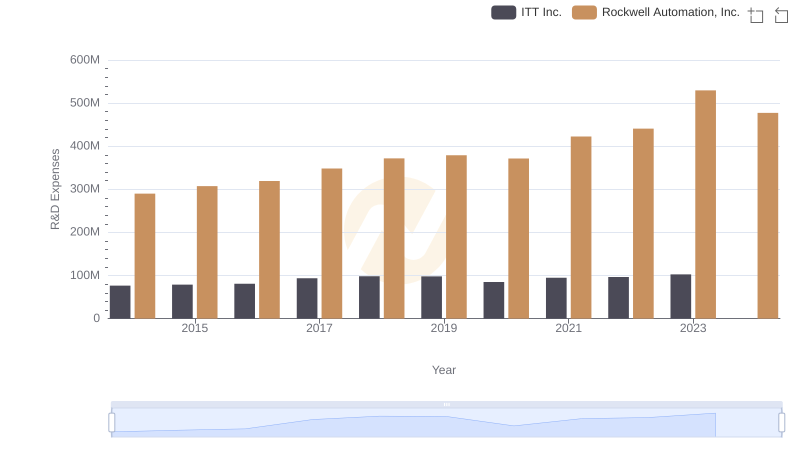
Research and Development: Comparing Key Metrics for Rockwell Automation, Inc. and ITT Inc.
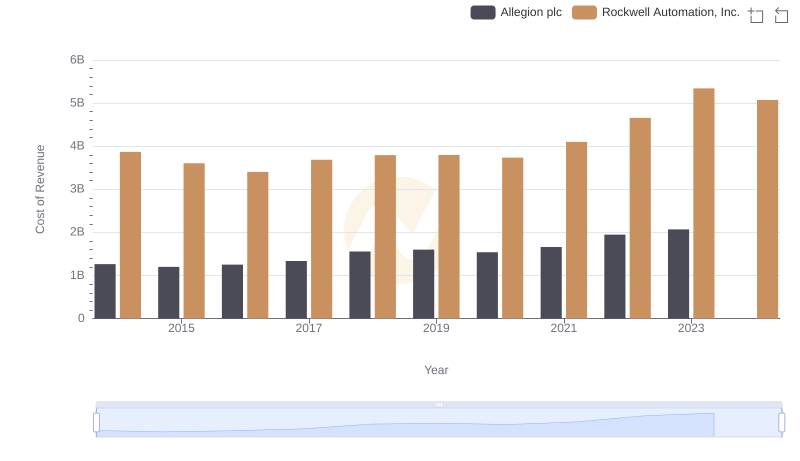
Cost of Revenue Comparison: Rockwell Automation, Inc. vs Allegion plc
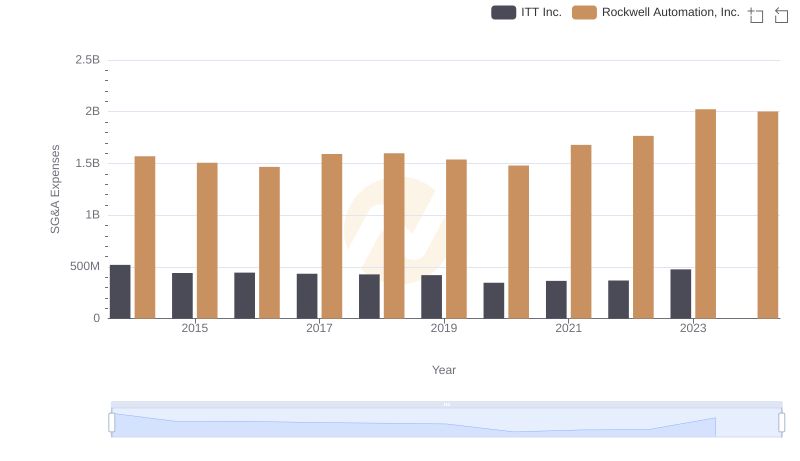
Rockwell Automation, Inc. and ITT Inc.: SG&A Spending Patterns Compared
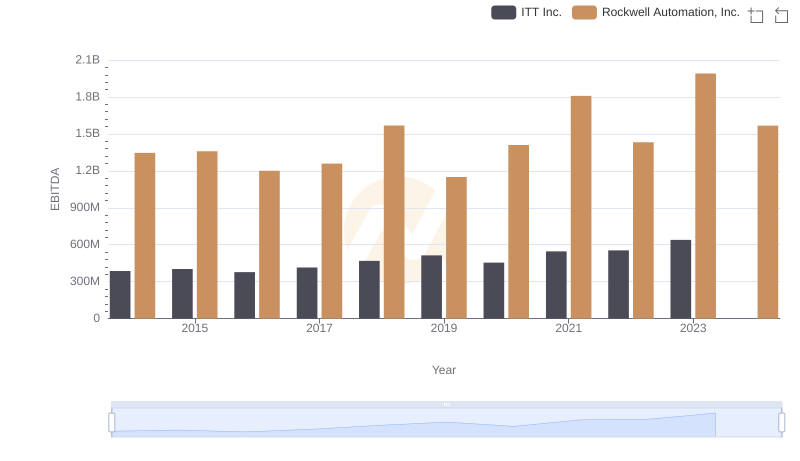
Rockwell Automation, Inc. vs ITT Inc.: In-Depth EBITDA Performance Comparison