| __timestamp | C.H. Robinson Worldwide, Inc. | Rockwell Automation, Inc. |
|---|---|---|
| Wednesday, January 1, 2014 | 805427000 | 1346000000 |
| Thursday, January 1, 2015 | 924719000 | 1359100000 |
| Friday, January 1, 2016 | 912200000 | 1200700000 |
| Sunday, January 1, 2017 | 868096000 | 1258400000 |
| Monday, January 1, 2018 | 1008812000 | 1568400000 |
| Tuesday, January 1, 2019 | 890425000 | 1150200000 |
| Wednesday, January 1, 2020 | 774995000 | 1410200000 |
| Friday, January 1, 2021 | 1173367000 | 1808300000 |
| Saturday, January 1, 2022 | 1359558000 | 1432100000 |
| Sunday, January 1, 2023 | 613592000 | 1990700000 |
| Monday, January 1, 2024 | 766301000 | 1567500000 |
Cracking the code
In the ever-evolving landscape of industrial automation and logistics, Rockwell Automation, Inc. and C.H. Robinson Worldwide, Inc. have emerged as key players. Over the past decade, their EBITDA performance has showcased intriguing trends.
From 2014 to 2023, Rockwell Automation's EBITDA has seen a robust growth trajectory, peaking in 2023 with a 48% increase from its 2014 figures. This consistent upward trend underscores the company's strategic initiatives and market adaptability.
Conversely, C.H. Robinson's EBITDA journey has been more volatile. Despite a notable 69% surge in 2022, the company faced a significant dip in 2023, reflecting the dynamic challenges in the logistics sector.
These insights offer a window into the strategic maneuvers and market conditions influencing these industry giants, providing valuable lessons for investors and industry enthusiasts alike.
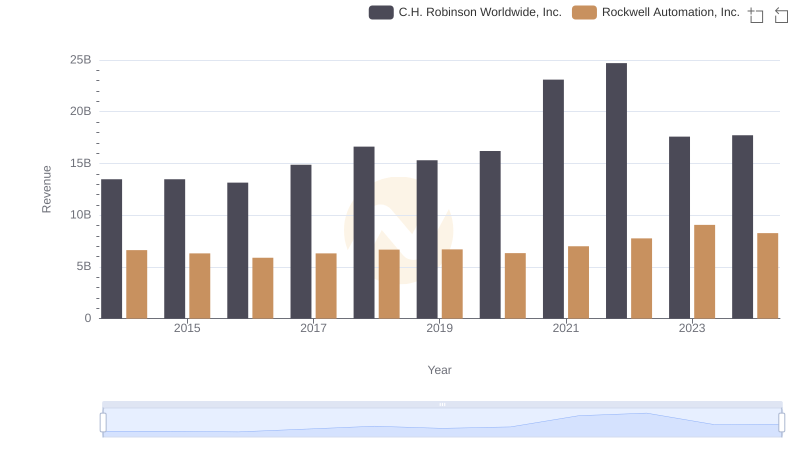
Rockwell Automation, Inc. vs C.H. Robinson Worldwide, Inc.: Annual Revenue Growth Compared
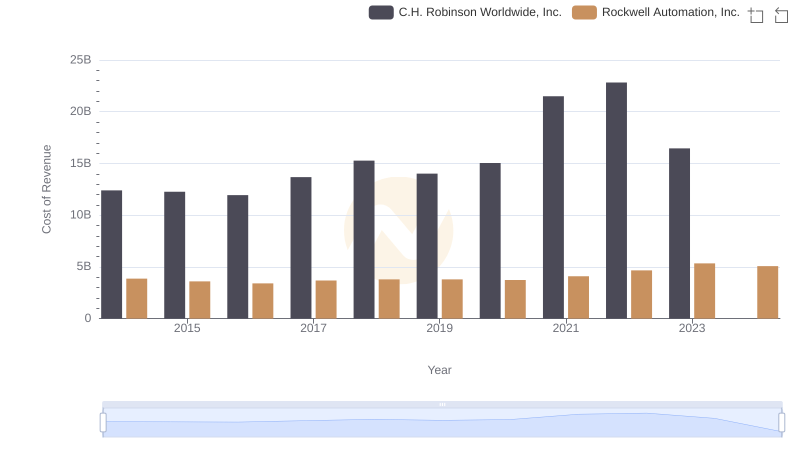
Analyzing Cost of Revenue: Rockwell Automation, Inc. and C.H. Robinson Worldwide, Inc.
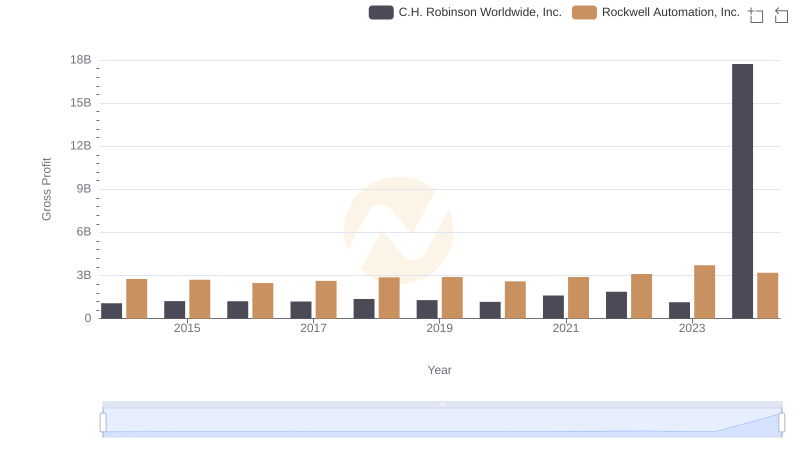
Key Insights on Gross Profit: Rockwell Automation, Inc. vs C.H. Robinson Worldwide, Inc.
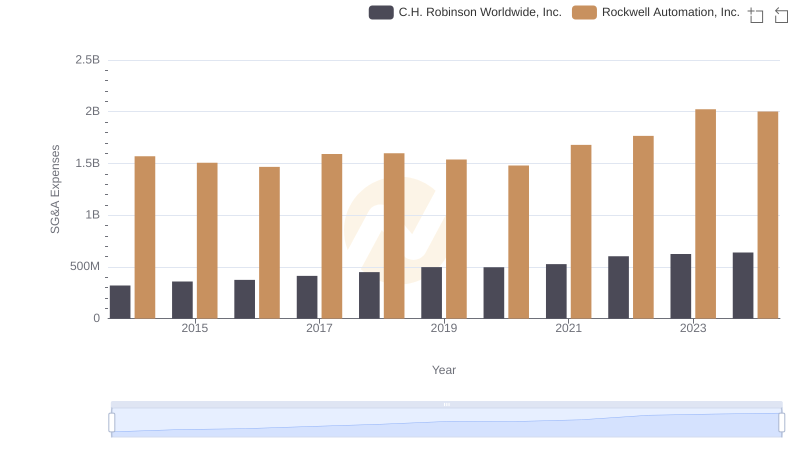
Cost Management Insights: SG&A Expenses for Rockwell Automation, Inc. and C.H. Robinson Worldwide, Inc.
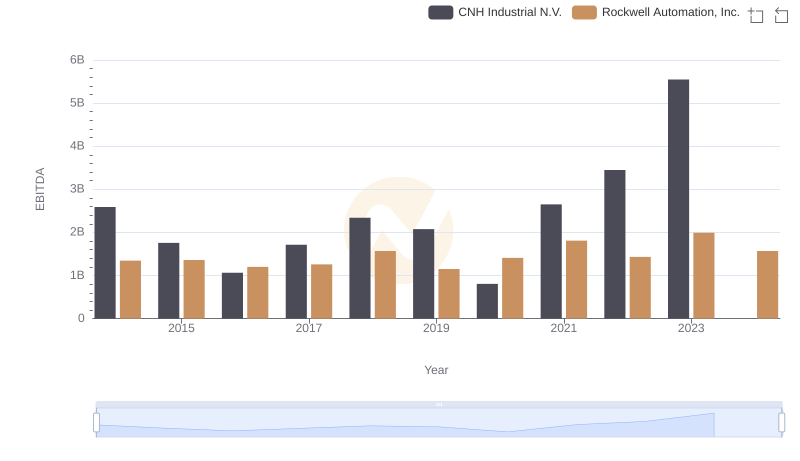
A Side-by-Side Analysis of EBITDA: Rockwell Automation, Inc. and CNH Industrial N.V.
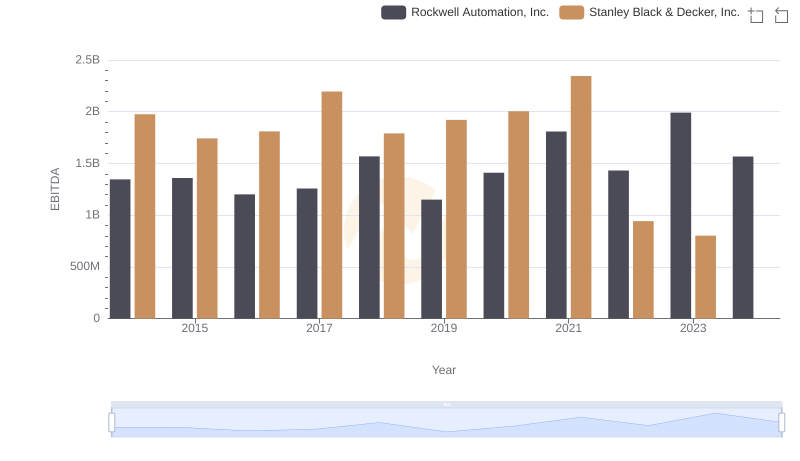
Comprehensive EBITDA Comparison: Rockwell Automation, Inc. vs Stanley Black & Decker, Inc.
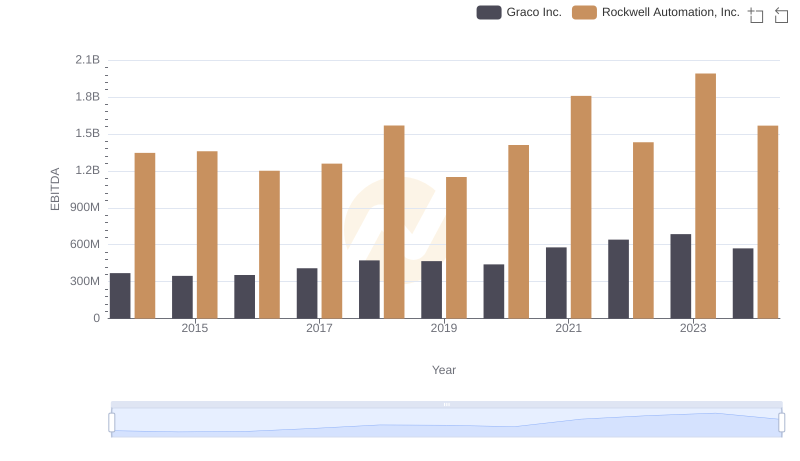
A Side-by-Side Analysis of EBITDA: Rockwell Automation, Inc. and Graco Inc.
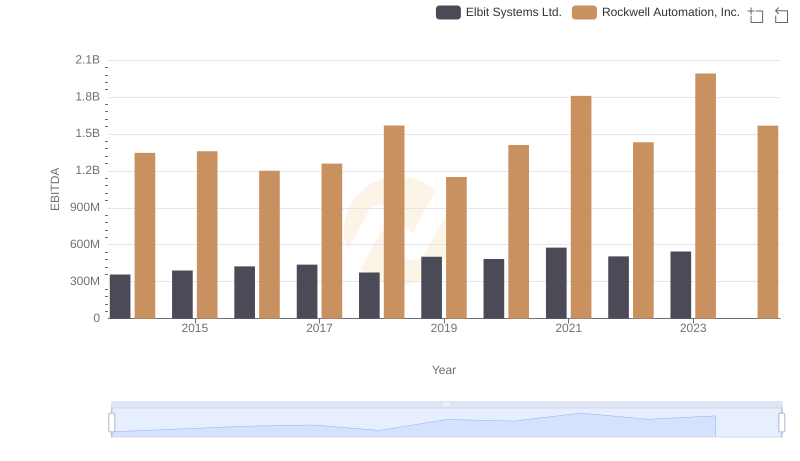
EBITDA Performance Review: Rockwell Automation, Inc. vs Elbit Systems Ltd.
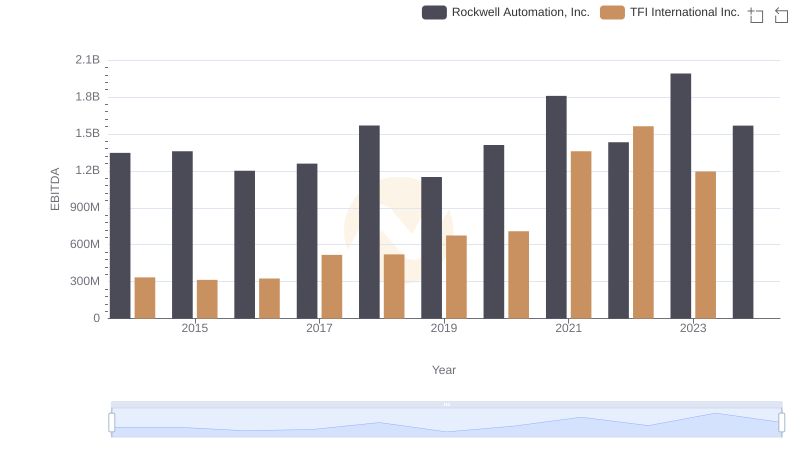
A Side-by-Side Analysis of EBITDA: Rockwell Automation, Inc. and TFI International Inc.
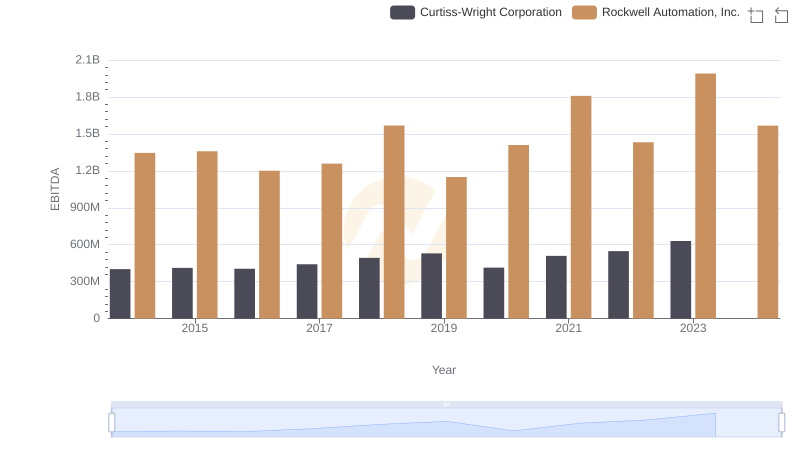
EBITDA Performance Review: Rockwell Automation, Inc. vs Curtiss-Wright Corporation