| __timestamp | C.H. Robinson Worldwide, Inc. | Rockwell Automation, Inc. |
|---|---|---|
| Wednesday, January 1, 2014 | 13470067000 | 6623500000 |
| Thursday, January 1, 2015 | 13476084000 | 6307900000 |
| Friday, January 1, 2016 | 13144413000 | 5879500000 |
| Sunday, January 1, 2017 | 14869380000 | 6311300000 |
| Monday, January 1, 2018 | 16631172000 | 6666000000 |
| Tuesday, January 1, 2019 | 15309508000 | 6694800000 |
| Wednesday, January 1, 2020 | 16207106000 | 6329800000 |
| Friday, January 1, 2021 | 23102138000 | 6997400000 |
| Saturday, January 1, 2022 | 24696625000 | 7760400000 |
| Sunday, January 1, 2023 | 17596443000 | 9058000000 |
| Monday, January 1, 2024 | 17724956000 | 8264200000 |
Unleashing the power of data
In the ever-evolving landscape of industrial automation and logistics, Rockwell Automation, Inc. and C.H. Robinson Worldwide, Inc. stand as titans. Over the past decade, these companies have showcased contrasting revenue trajectories. From 2014 to 2023, C.H. Robinson's revenue surged by approximately 32%, peaking in 2022, while Rockwell Automation experienced a steady growth of around 37%, reaching its zenith in 2023.
C.H. Robinson's revenue saw a remarkable spike in 2021, growing by nearly 43% from the previous year, reflecting its adaptability in a volatile market. Meanwhile, Rockwell Automation's consistent growth underscores its resilience and innovation in automation solutions. As we look to 2024, both companies continue to navigate the challenges and opportunities of their respective industries, setting benchmarks for future growth.
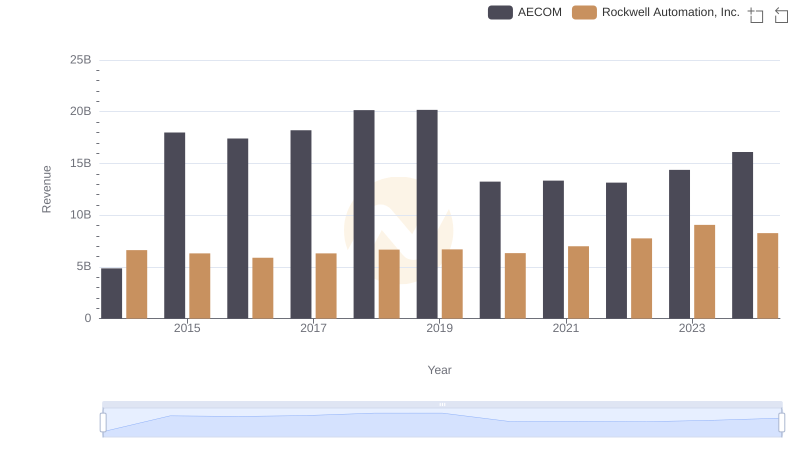
Breaking Down Revenue Trends: Rockwell Automation, Inc. vs AECOM

Revenue Showdown: Rockwell Automation, Inc. vs Saia, Inc.
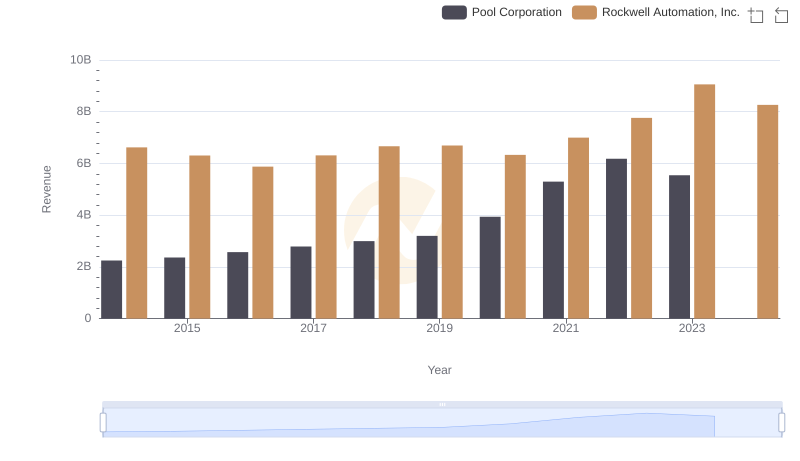
Annual Revenue Comparison: Rockwell Automation, Inc. vs Pool Corporation
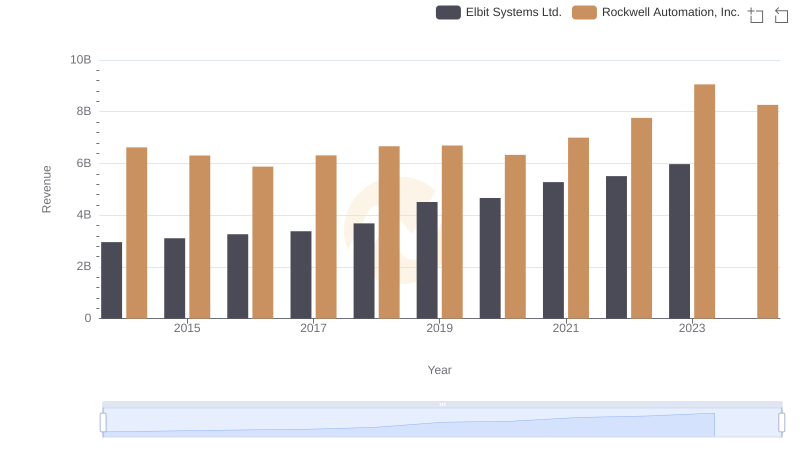
Revenue Showdown: Rockwell Automation, Inc. vs Elbit Systems Ltd.

Breaking Down Revenue Trends: Rockwell Automation, Inc. vs Curtiss-Wright Corporation
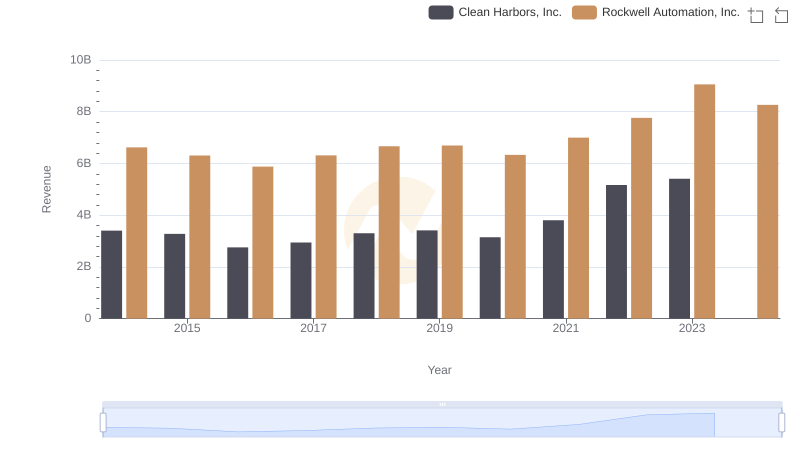
Comparing Revenue Performance: Rockwell Automation, Inc. or Clean Harbors, Inc.?
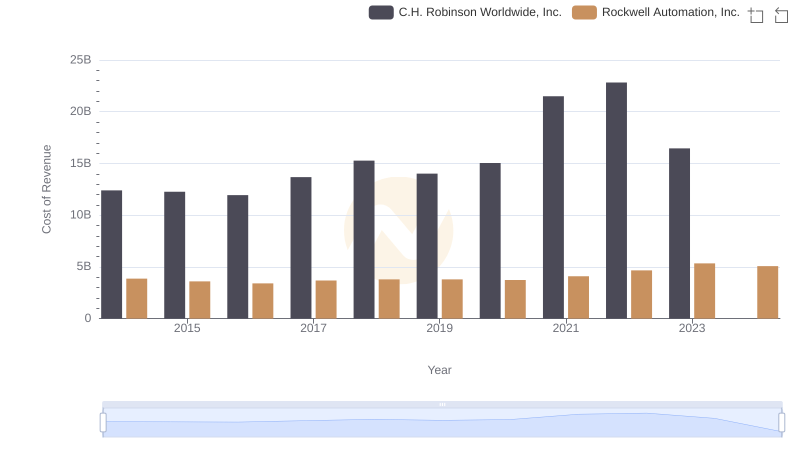
Analyzing Cost of Revenue: Rockwell Automation, Inc. and C.H. Robinson Worldwide, Inc.
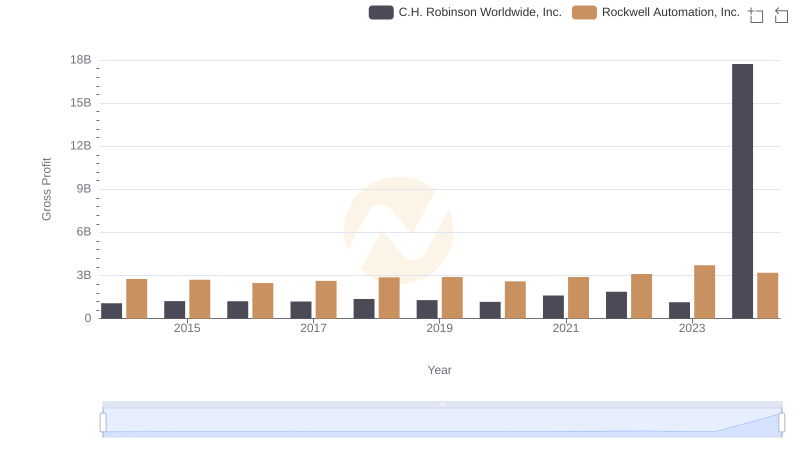
Key Insights on Gross Profit: Rockwell Automation, Inc. vs C.H. Robinson Worldwide, Inc.
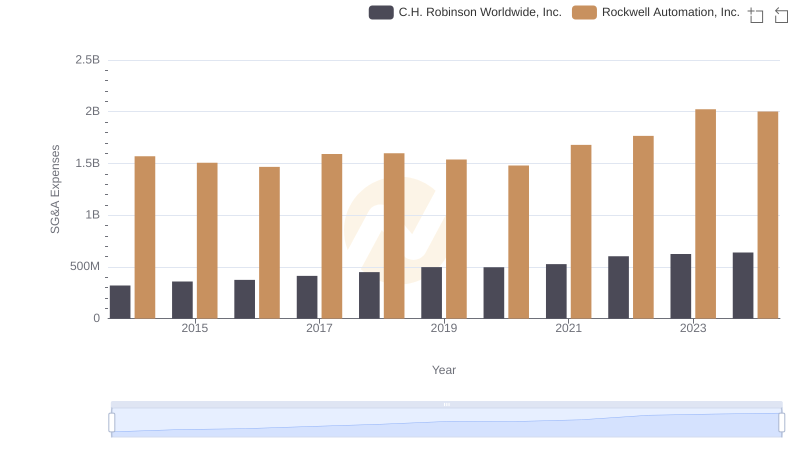
Cost Management Insights: SG&A Expenses for Rockwell Automation, Inc. and C.H. Robinson Worldwide, Inc.
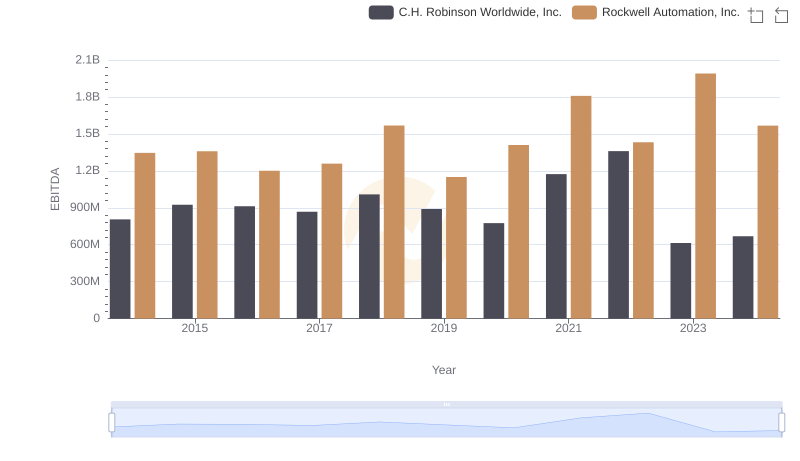
Rockwell Automation, Inc. and C.H. Robinson Worldwide, Inc.: A Detailed Examination of EBITDA Performance