| __timestamp | Cintas Corporation | Graco Inc. |
|---|---|---|
| Wednesday, January 1, 2014 | 4551812000 | 1221130000 |
| Thursday, January 1, 2015 | 4476886000 | 1286485000 |
| Friday, January 1, 2016 | 4905458000 | 1329293000 |
| Sunday, January 1, 2017 | 5323381000 | 1474744000 |
| Monday, January 1, 2018 | 6476632000 | 1653292000 |
| Tuesday, January 1, 2019 | 6892303000 | 1646045000 |
| Wednesday, January 1, 2020 | 7085120000 | 1650115000 |
| Friday, January 1, 2021 | 7116340000 | 1987608000 |
| Saturday, January 1, 2022 | 7854459000 | 2143521000 |
| Sunday, January 1, 2023 | 8815769000 | 2195606000 |
| Monday, January 1, 2024 | 9596615000 | 2113316000 |
Unleashing the power of data
In the competitive landscape of industrial services and manufacturing, Cintas Corporation and Graco Inc. have demonstrated remarkable revenue trajectories over the past decade. Since 2014, Cintas Corporation has seen its revenue soar by over 110%, reaching nearly $9.6 billion in 2024. This growth reflects a robust annual increase, averaging around 10% per year. Meanwhile, Graco Inc. has also experienced a steady climb, with its revenue increasing by approximately 73% over the same period, peaking at $2.2 billion in 2023.
Cintas's strategic expansions and acquisitions have fueled its impressive growth, while Graco's focus on innovation and product development has solidified its market position. As we look to the future, these companies continue to set benchmarks in their respective industries, showcasing resilience and adaptability in an ever-evolving market.
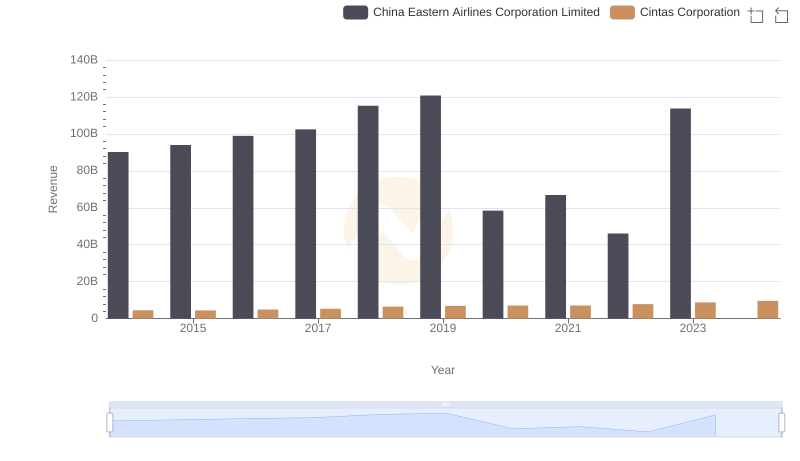
Annual Revenue Comparison: Cintas Corporation vs China Eastern Airlines Corporation Limited
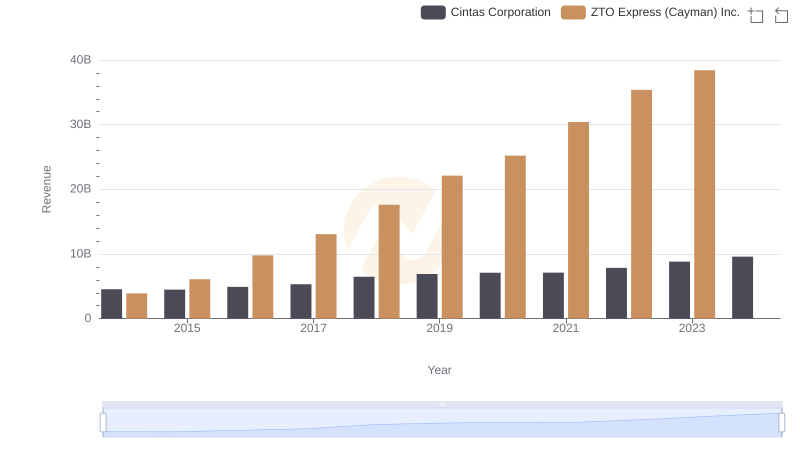
Annual Revenue Comparison: Cintas Corporation vs ZTO Express (Cayman) Inc.
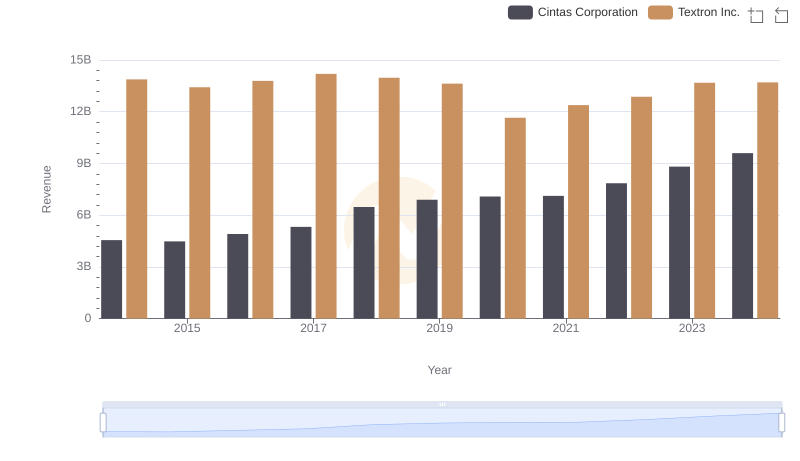
Cintas Corporation vs Textron Inc.: Annual Revenue Growth Compared
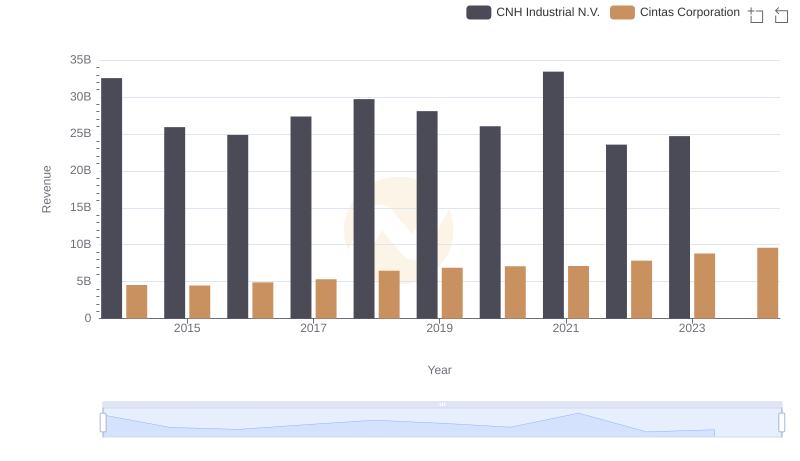
Cintas Corporation and CNH Industrial N.V.: A Comprehensive Revenue Analysis
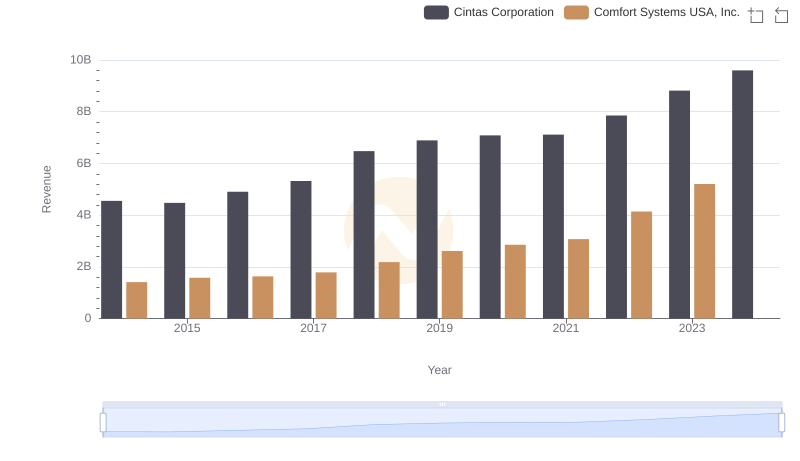
Cintas Corporation and Comfort Systems USA, Inc.: A Comprehensive Revenue Analysis
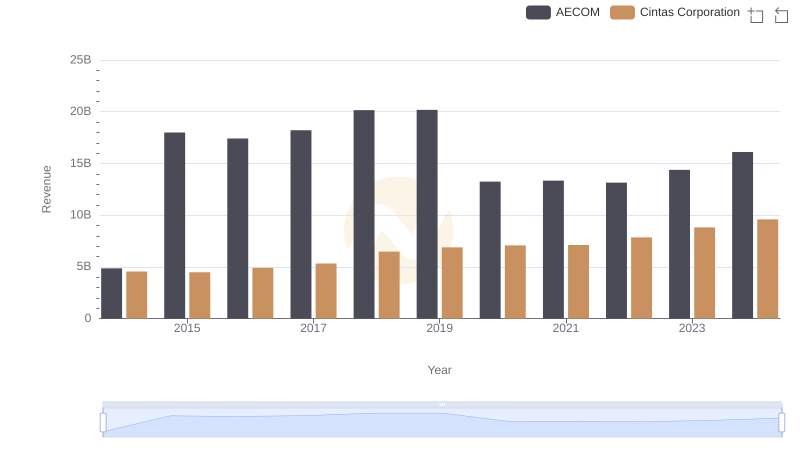
Breaking Down Revenue Trends: Cintas Corporation vs AECOM
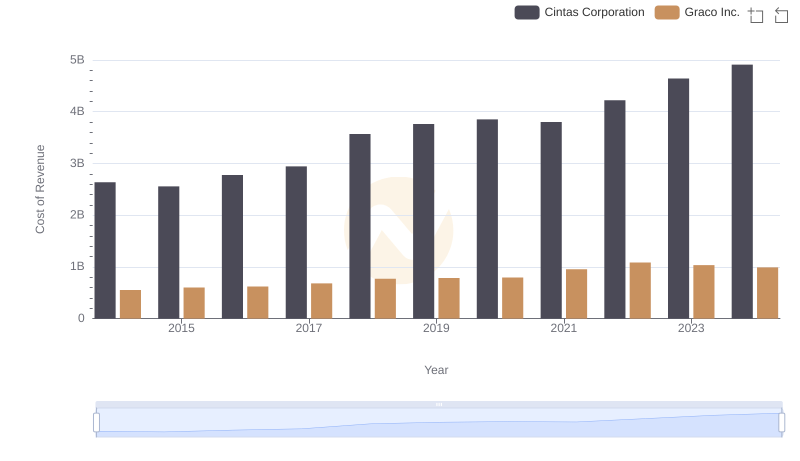
Analyzing Cost of Revenue: Cintas Corporation and Graco Inc.
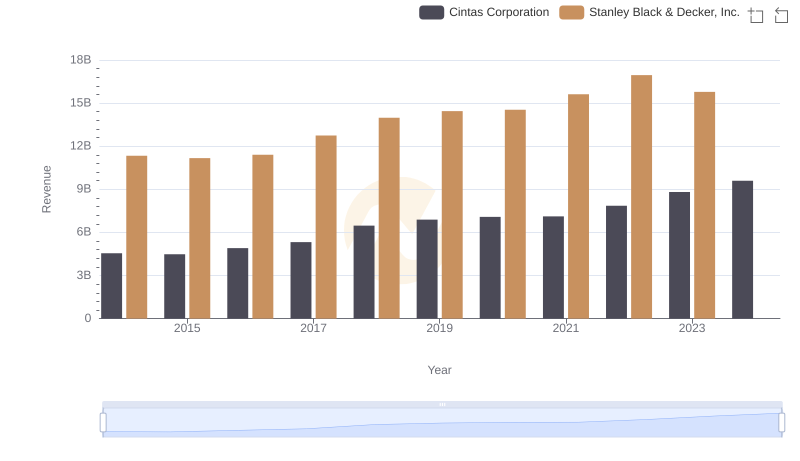
Breaking Down Revenue Trends: Cintas Corporation vs Stanley Black & Decker, Inc.

Gross Profit Analysis: Comparing Cintas Corporation and Graco Inc.

Comparing SG&A Expenses: Cintas Corporation vs Graco Inc. Trends and Insights
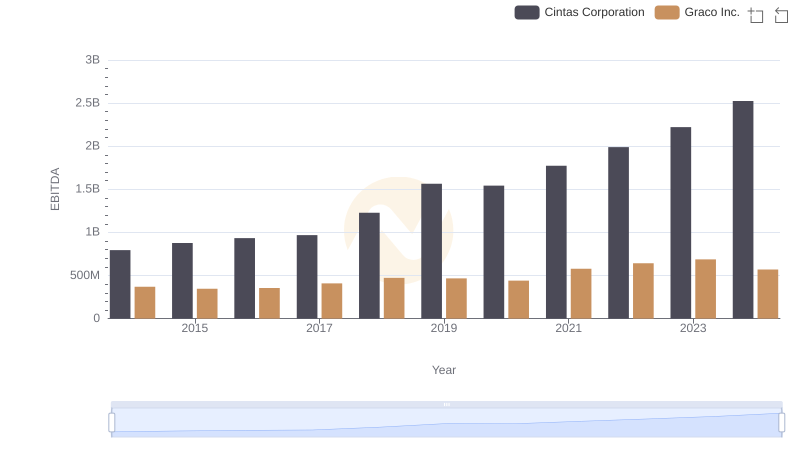
Comprehensive EBITDA Comparison: Cintas Corporation vs Graco Inc.