| __timestamp | Cintas Corporation | Graco Inc. |
|---|---|---|
| Wednesday, January 1, 2014 | 1914386000 | 666736000 |
| Thursday, January 1, 2015 | 1921337000 | 684700000 |
| Friday, January 1, 2016 | 2129870000 | 708239000 |
| Sunday, January 1, 2017 | 2380295000 | 793049000 |
| Monday, January 1, 2018 | 2908523000 | 882539000 |
| Tuesday, January 1, 2019 | 3128588000 | 859756000 |
| Wednesday, January 1, 2020 | 3233748000 | 854937000 |
| Friday, January 1, 2021 | 3314651000 | 1033949000 |
| Saturday, January 1, 2022 | 3632246000 | 1057439000 |
| Sunday, January 1, 2023 | 4173368000 | 1161021000 |
| Monday, January 1, 2024 | 4686416000 | 1122461000 |
Unleashing the power of data
In the competitive landscape of industrial services and manufacturing, Cintas Corporation and Graco Inc. have shown remarkable growth in gross profit over the past decade. Since 2014, Cintas Corporation has seen its gross profit soar by over 145%, reaching a peak in 2024. This impressive growth reflects Cintas's strategic expansion and operational efficiency. Meanwhile, Graco Inc. has also demonstrated steady growth, with a 68% increase in gross profit over the same period, highlighting its resilience and adaptability in the manufacturing sector.
These trends underscore the dynamic nature of these companies and their ability to thrive in evolving markets.
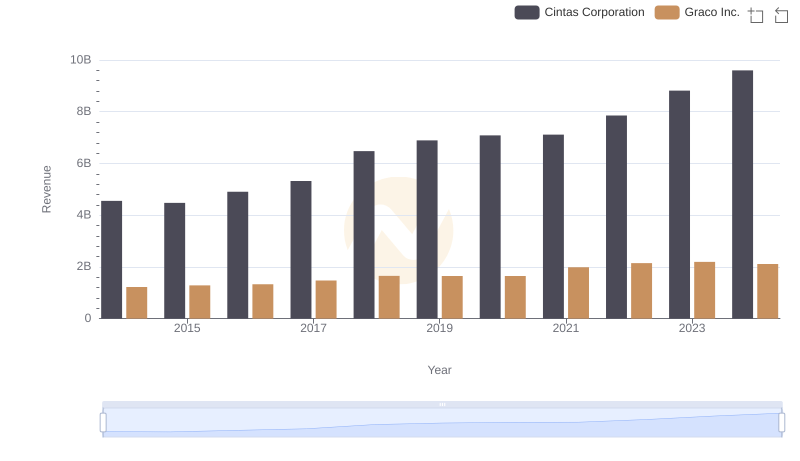
Cintas Corporation and Graco Inc.: A Comprehensive Revenue Analysis
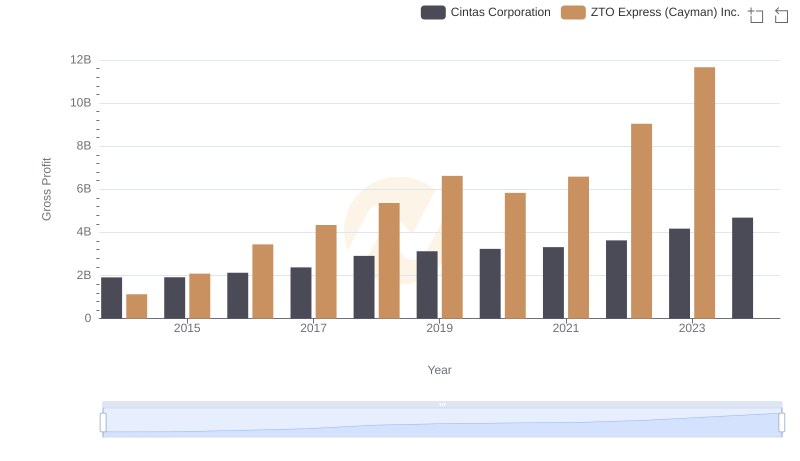
Cintas Corporation vs ZTO Express (Cayman) Inc.: A Gross Profit Performance Breakdown
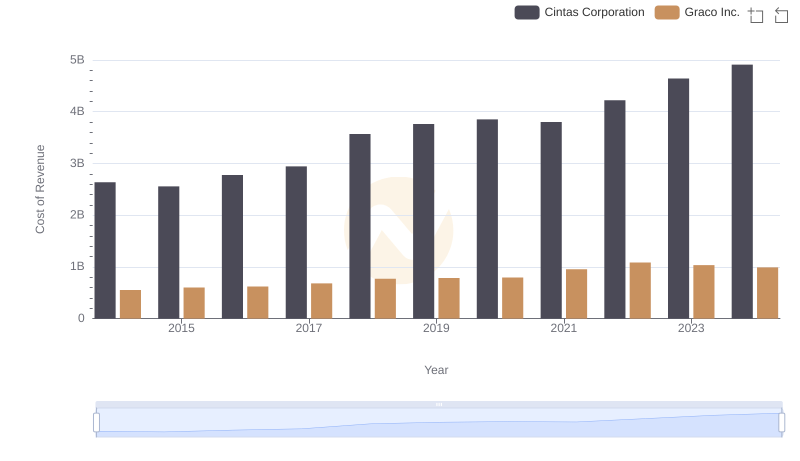
Analyzing Cost of Revenue: Cintas Corporation and Graco Inc.
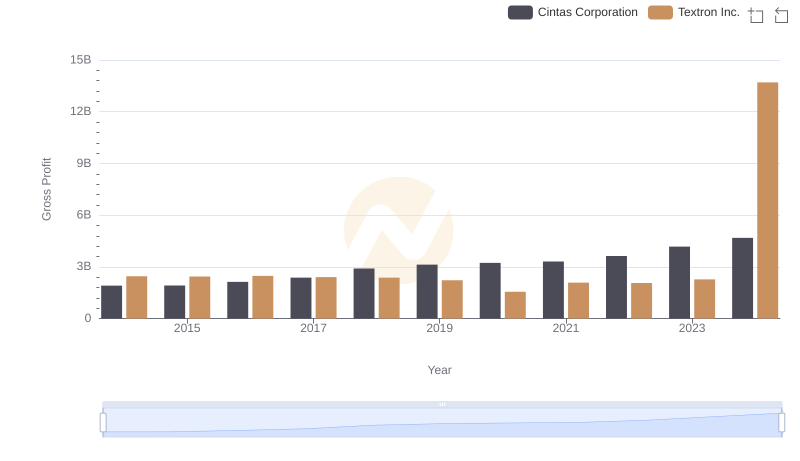
Key Insights on Gross Profit: Cintas Corporation vs Textron Inc.
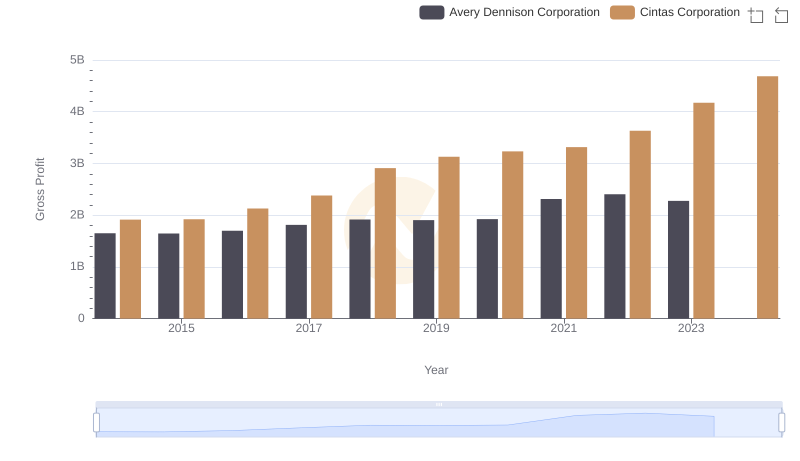
Who Generates Higher Gross Profit? Cintas Corporation or Avery Dennison Corporation
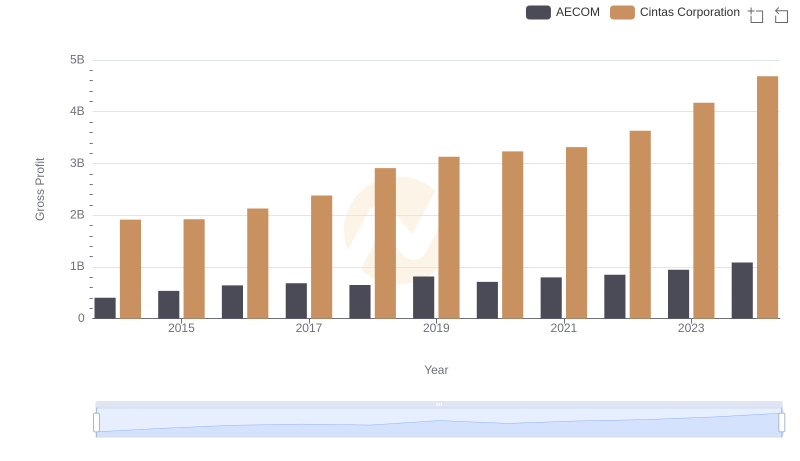
Gross Profit Trends Compared: Cintas Corporation vs AECOM
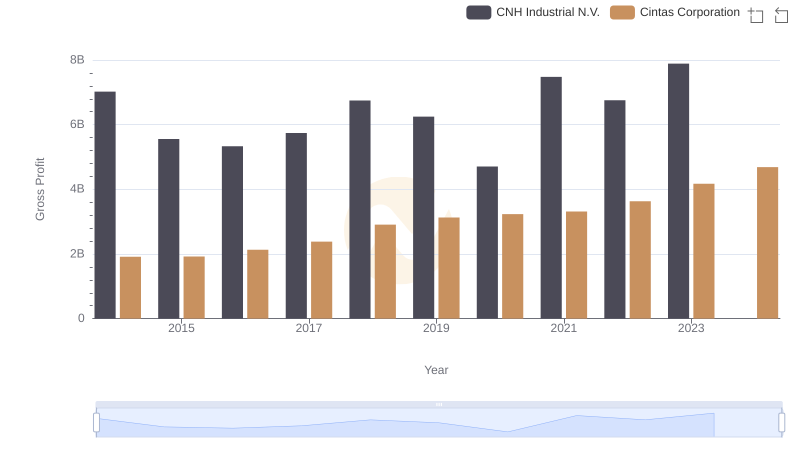
Who Generates Higher Gross Profit? Cintas Corporation or CNH Industrial N.V.

Key Insights on Gross Profit: Cintas Corporation vs Comfort Systems USA, Inc.

Comparing SG&A Expenses: Cintas Corporation vs Graco Inc. Trends and Insights
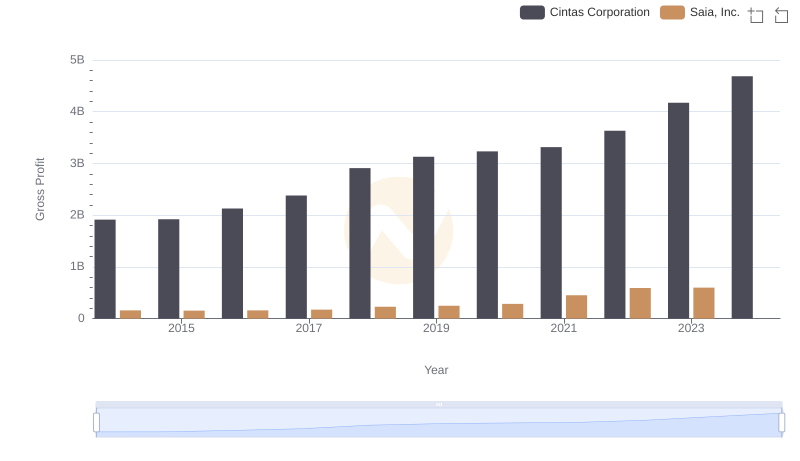
Who Generates Higher Gross Profit? Cintas Corporation or Saia, Inc.
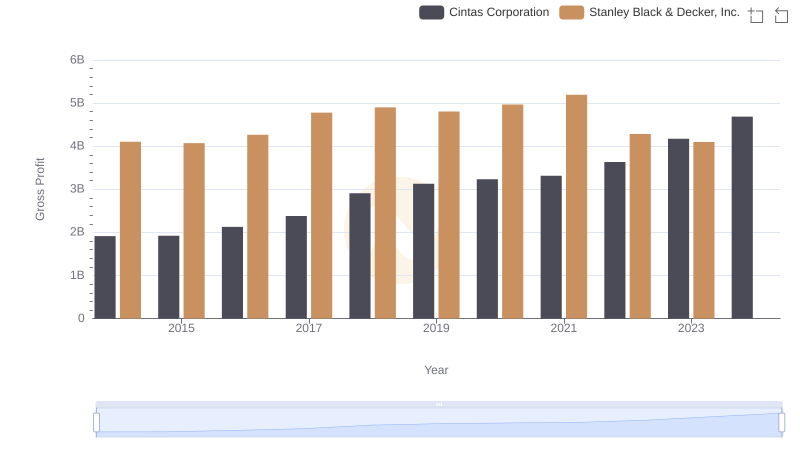
Key Insights on Gross Profit: Cintas Corporation vs Stanley Black & Decker, Inc.
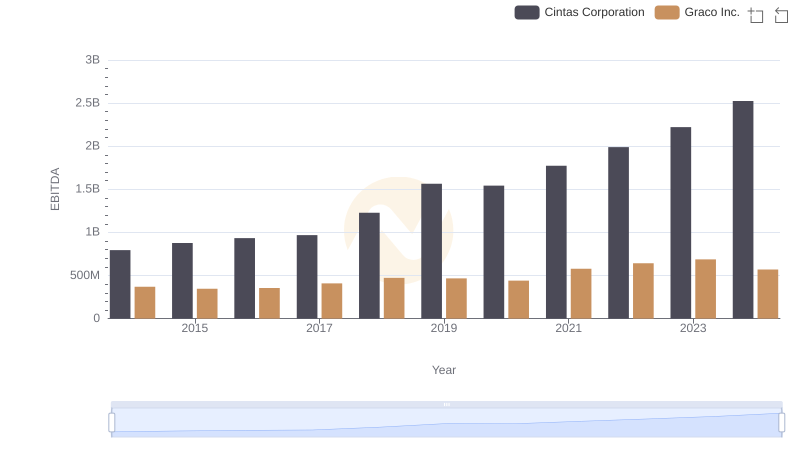
Comprehensive EBITDA Comparison: Cintas Corporation vs Graco Inc.