| __timestamp | Cintas Corporation | Graco Inc. |
|---|---|---|
| Wednesday, January 1, 2014 | 1302752000 | 303565000 |
| Thursday, January 1, 2015 | 1224930000 | 324016000 |
| Friday, January 1, 2016 | 1348122000 | 341734000 |
| Sunday, January 1, 2017 | 1527380000 | 372496000 |
| Monday, January 1, 2018 | 1916792000 | 382988000 |
| Tuesday, January 1, 2019 | 1980644000 | 367743000 |
| Wednesday, January 1, 2020 | 2071052000 | 355796000 |
| Friday, January 1, 2021 | 1929159000 | 422975000 |
| Saturday, January 1, 2022 | 2044876000 | 404731000 |
| Sunday, January 1, 2023 | 2370704000 | 432156000 |
| Monday, January 1, 2024 | 2617783000 | 465133000 |
In pursuit of knowledge
In the competitive landscape of corporate America, understanding the financial strategies of industry leaders is crucial. This analysis delves into the Selling, General, and Administrative (SG&A) expenses of Cintas Corporation and Graco Inc. from 2014 to 2024.
Cintas Corporation has seen a remarkable 101% increase in SG&A expenses over the decade, reflecting its aggressive growth strategy. From 2014 to 2023, the company's expenses rose from approximately $1.3 billion to $2.4 billion, indicating a robust expansion in operations and market reach.
In contrast, Graco Inc. maintained a more conservative approach, with a 53% increase in SG&A expenses over the same period. Starting at $303 million in 2014, the expenses reached $432 million by 2023, showcasing a steady yet cautious growth trajectory.
This comparative analysis highlights the diverse strategies employed by these companies in managing operational costs, offering valuable insights for investors and industry analysts alike.
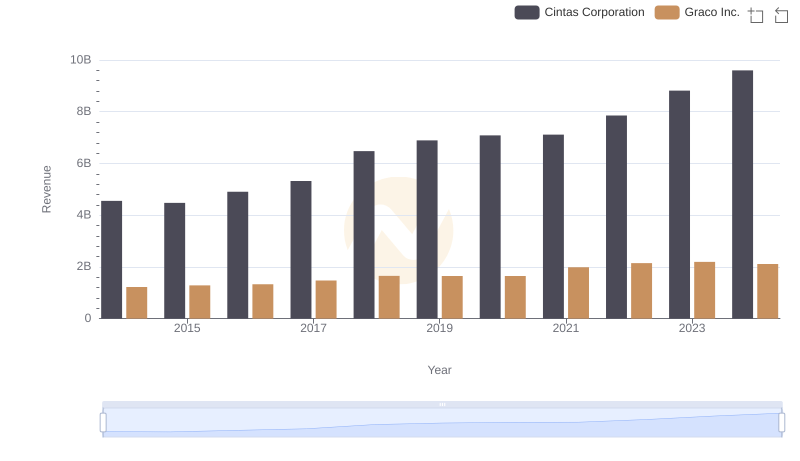
Cintas Corporation and Graco Inc.: A Comprehensive Revenue Analysis
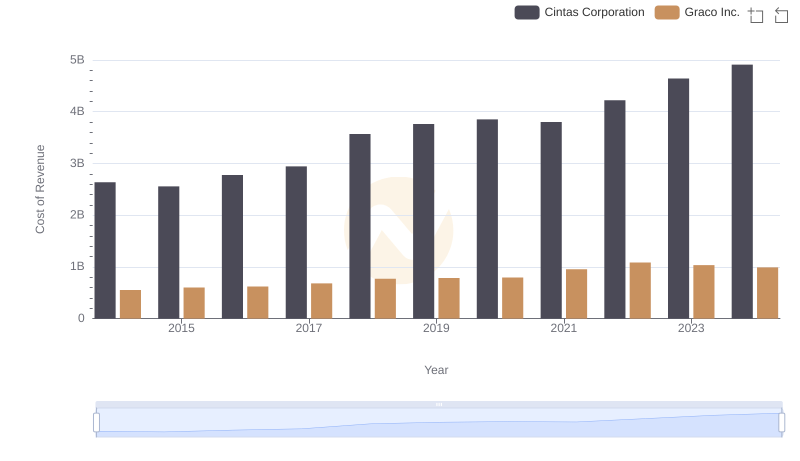
Analyzing Cost of Revenue: Cintas Corporation and Graco Inc.
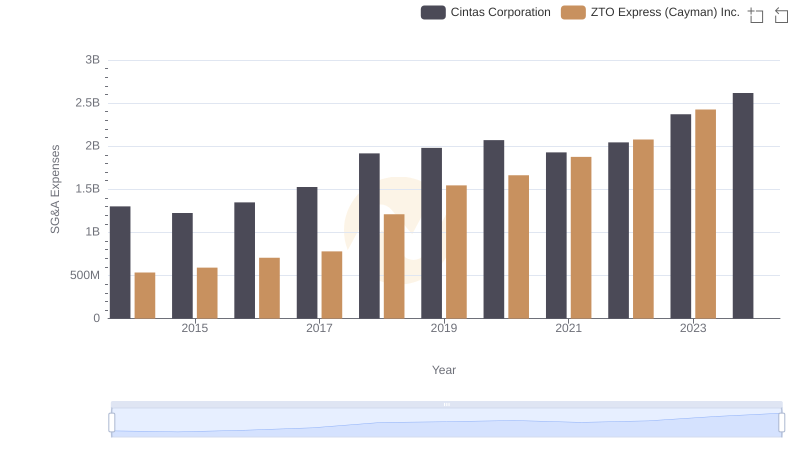
Cost Management Insights: SG&A Expenses for Cintas Corporation and ZTO Express (Cayman) Inc.

Gross Profit Analysis: Comparing Cintas Corporation and Graco Inc.
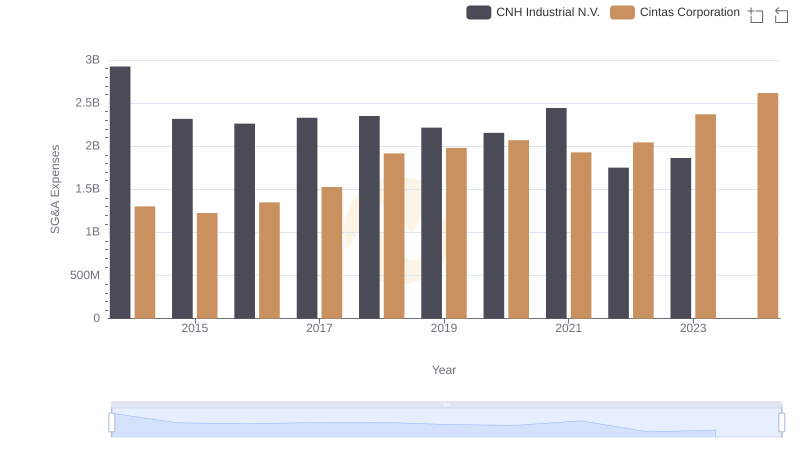
Cintas Corporation or CNH Industrial N.V.: Who Manages SG&A Costs Better?
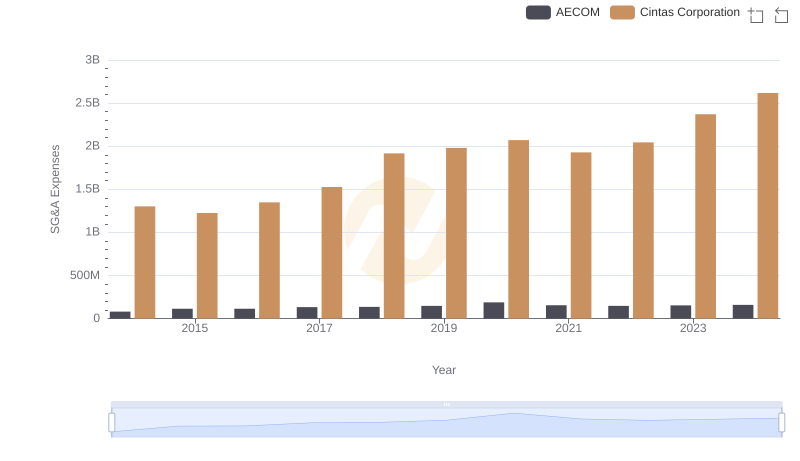
SG&A Efficiency Analysis: Comparing Cintas Corporation and AECOM

Breaking Down SG&A Expenses: Cintas Corporation vs Comfort Systems USA, Inc.
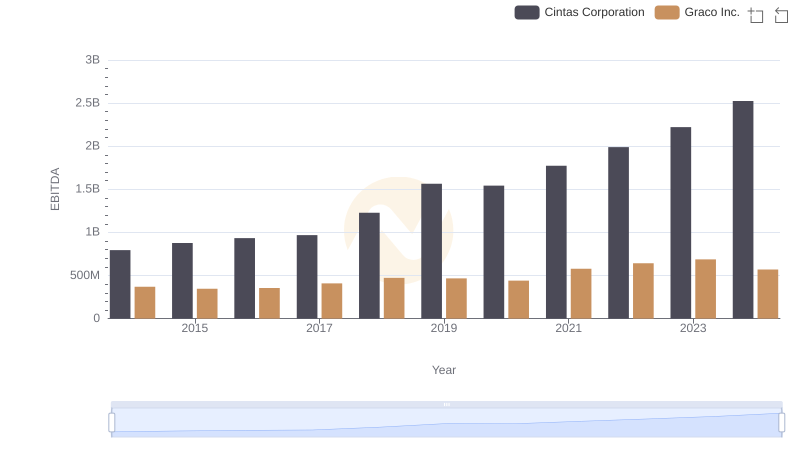
Comprehensive EBITDA Comparison: Cintas Corporation vs Graco Inc.
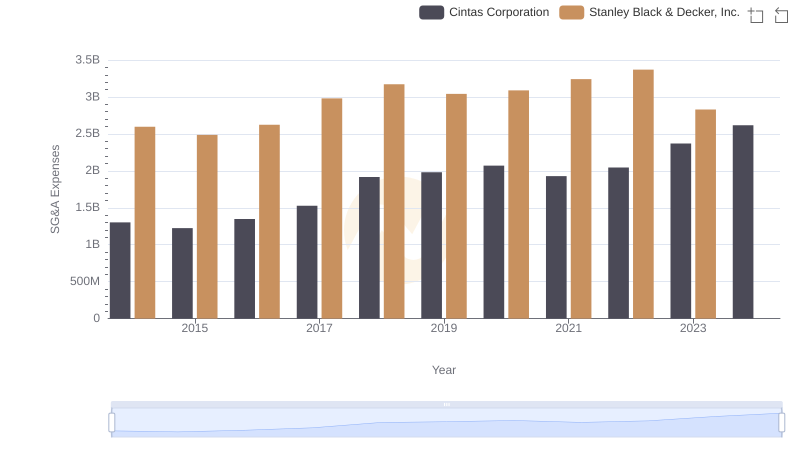
Cintas Corporation or Stanley Black & Decker, Inc.: Who Manages SG&A Costs Better?
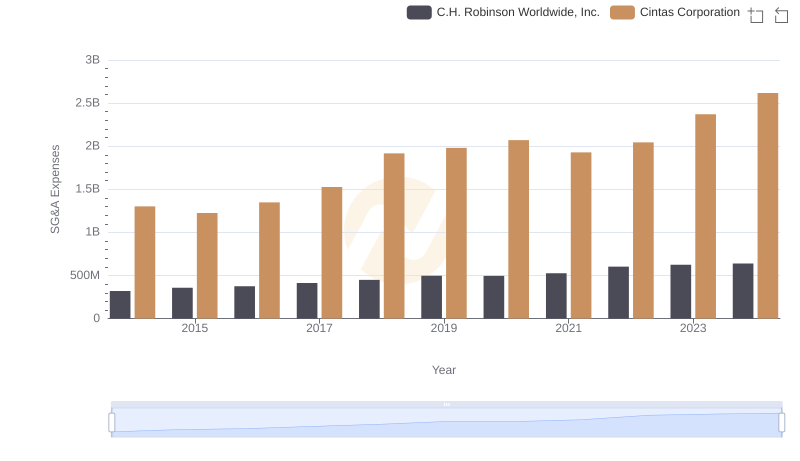
Cintas Corporation or C.H. Robinson Worldwide, Inc.: Who Manages SG&A Costs Better?