| __timestamp | Axon Enterprise, Inc. | Hubbell Incorporated |
|---|---|---|
| Wednesday, January 1, 2014 | 101548000 | 1109000000 |
| Thursday, January 1, 2015 | 128647000 | 1091800000 |
| Friday, January 1, 2016 | 170536000 | 1100700000 |
| Sunday, January 1, 2017 | 207088000 | 1151900000 |
| Monday, January 1, 2018 | 258583000 | 1300400000 |
| Tuesday, January 1, 2019 | 307286000 | 1352700000 |
| Wednesday, January 1, 2020 | 416331000 | 1209300000 |
| Friday, January 1, 2021 | 540910000 | 1151500000 |
| Saturday, January 1, 2022 | 728638000 | 1471600000 |
| Sunday, January 1, 2023 | 955382000 | 1888100000 |
| Monday, January 1, 2024 | 1904100000 |
Unleashing the power of data
In the ever-evolving landscape of American industry, the financial trajectories of Axon Enterprise, Inc. and Hubbell Incorporated offer a fascinating study in contrast. Over the past decade, Axon has demonstrated a remarkable growth in gross profit, surging by over 840% from 2014 to 2023. This growth reflects Axon's strategic innovations and market expansion, particularly in the public safety sector. Meanwhile, Hubbell Incorporated, a stalwart in electrical and utility solutions, has maintained a steady upward trajectory, with a 70% increase in gross profit over the same period. This consistent performance underscores Hubbell's resilience and adaptability in a competitive market. As of 2023, Hubbell's gross profit stands at nearly double that of Axon, highlighting the scale and reach of its operations. These insights not only reveal the financial health of these companies but also provide a window into the broader economic trends shaping their industries.
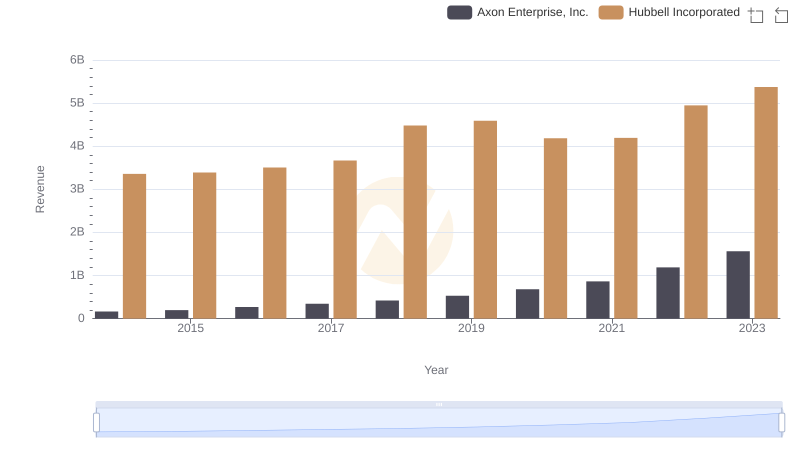
Comparing Revenue Performance: Axon Enterprise, Inc. or Hubbell Incorporated?
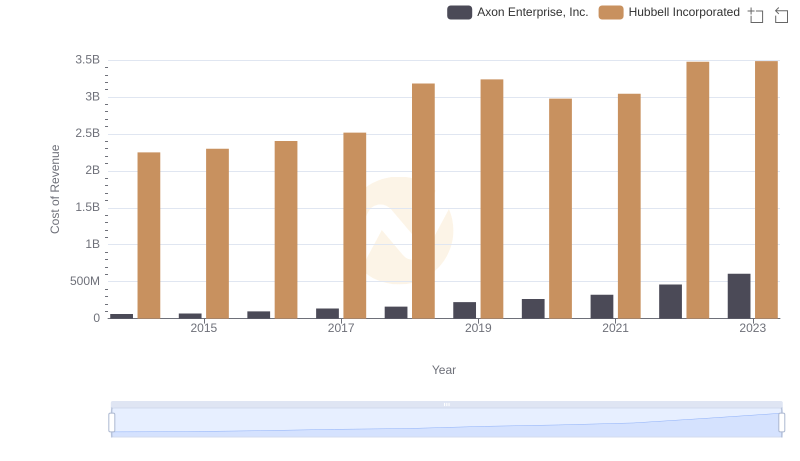
Analyzing Cost of Revenue: Axon Enterprise, Inc. and Hubbell Incorporated
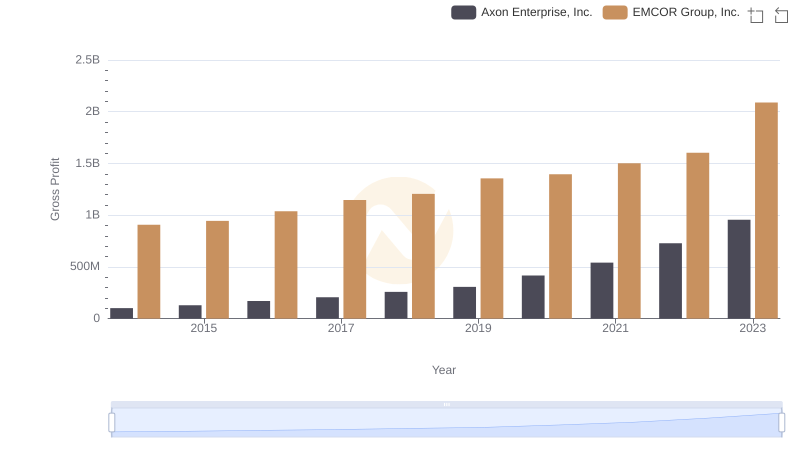
Key Insights on Gross Profit: Axon Enterprise, Inc. vs EMCOR Group, Inc.
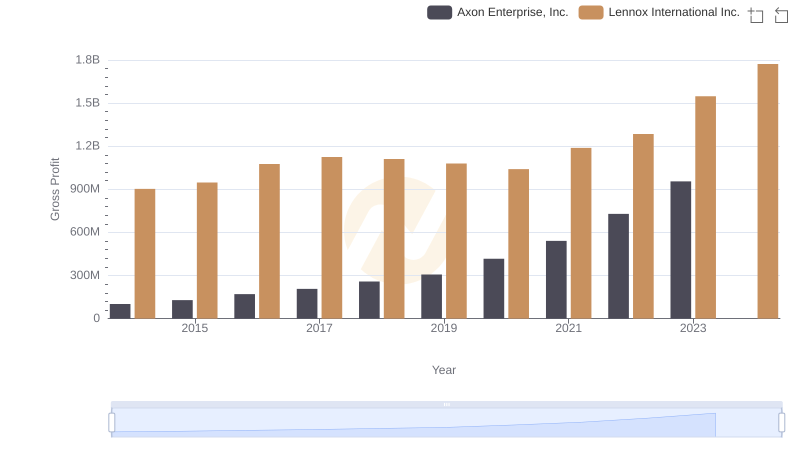
Gross Profit Analysis: Comparing Axon Enterprise, Inc. and Lennox International Inc.
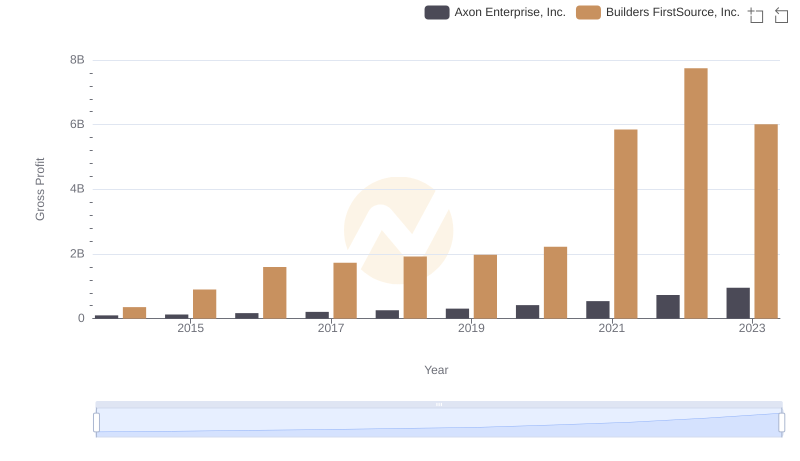
Gross Profit Trends Compared: Axon Enterprise, Inc. vs Builders FirstSource, Inc.
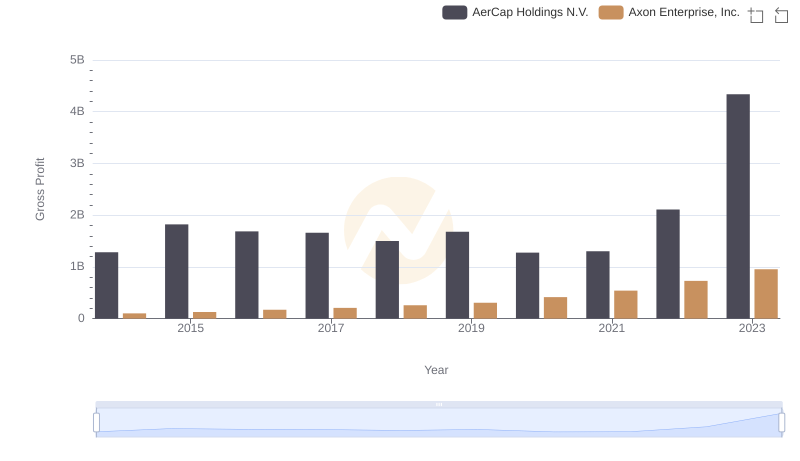
Key Insights on Gross Profit: Axon Enterprise, Inc. vs AerCap Holdings N.V.
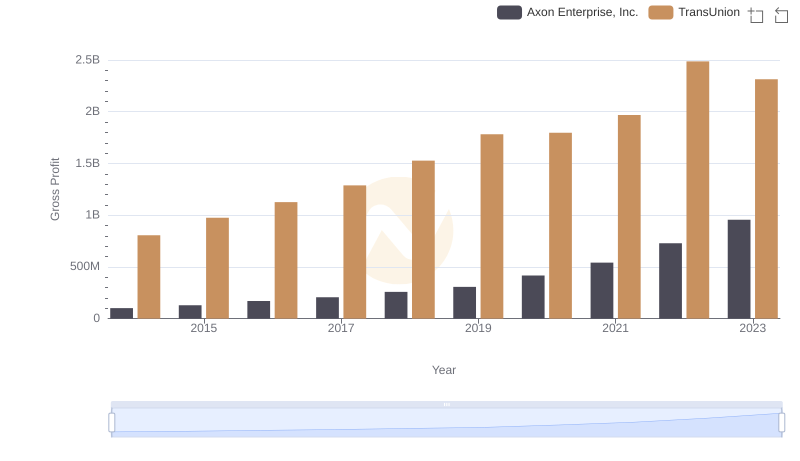
Gross Profit Comparison: Axon Enterprise, Inc. and TransUnion Trends
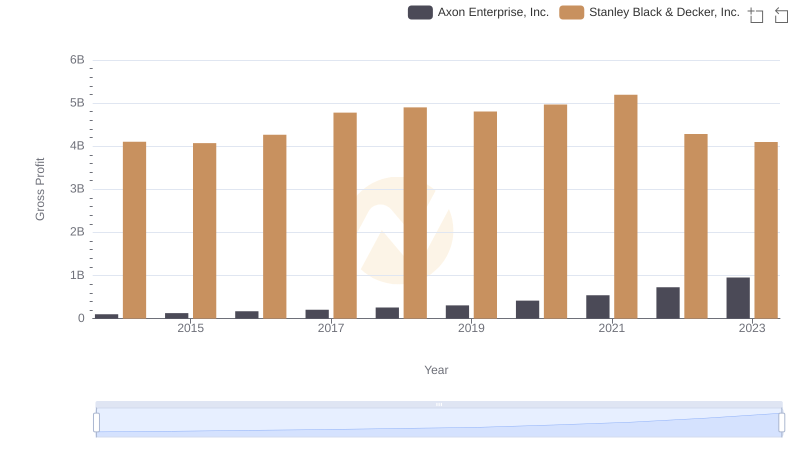
Axon Enterprise, Inc. and Stanley Black & Decker, Inc.: A Detailed Gross Profit Analysis