| __timestamp | Axon Enterprise, Inc. | Hubbell Incorporated |
|---|---|---|
| Wednesday, January 1, 2014 | 164525000 | 3359400000 |
| Thursday, January 1, 2015 | 197892000 | 3390400000 |
| Friday, January 1, 2016 | 268245000 | 3505200000 |
| Sunday, January 1, 2017 | 343798000 | 3668800000 |
| Monday, January 1, 2018 | 420068000 | 4481700000 |
| Tuesday, January 1, 2019 | 530860000 | 4591000000 |
| Wednesday, January 1, 2020 | 681003000 | 4186000000 |
| Friday, January 1, 2021 | 863381000 | 4194100000 |
| Saturday, January 1, 2022 | 1189935000 | 4947900000 |
| Sunday, January 1, 2023 | 1563391000 | 5372900000 |
| Monday, January 1, 2024 | 5628500000 |
Infusing magic into the data realm
In the ever-evolving landscape of the American stock market, two companies have shown remarkable revenue trajectories over the past decade. Axon Enterprise, Inc., known for its innovative public safety technologies, has seen its revenue skyrocket by over 850% from 2014 to 2023. Starting at a modest $165 million in 2014, Axon reached an impressive $1.56 billion by 2023, reflecting its strategic growth and market expansion.
On the other hand, Hubbell Incorporated, a stalwart in the electrical and electronic products industry, has maintained a steady revenue increase of approximately 60% over the same period. From $3.36 billion in 2014, Hubbell's revenue climbed to $5.37 billion in 2023, showcasing its resilience and consistent market demand.
This comparison highlights the dynamic nature of revenue growth strategies, with Axon focusing on rapid expansion and Hubbell emphasizing steady, reliable growth.

Axon Enterprise, Inc. or Dover Corporation: Who Leads in Yearly Revenue?
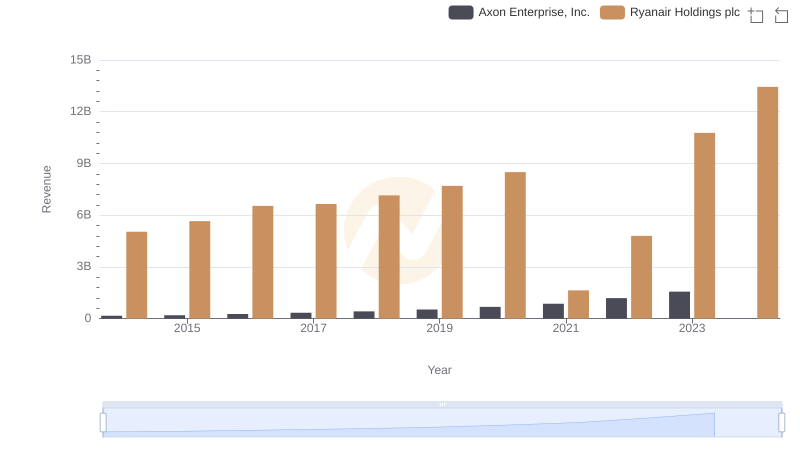
Axon Enterprise, Inc. and Ryanair Holdings plc: A Comprehensive Revenue Analysis

Revenue Insights: Axon Enterprise, Inc. and Lennox International Inc. Performance Compared
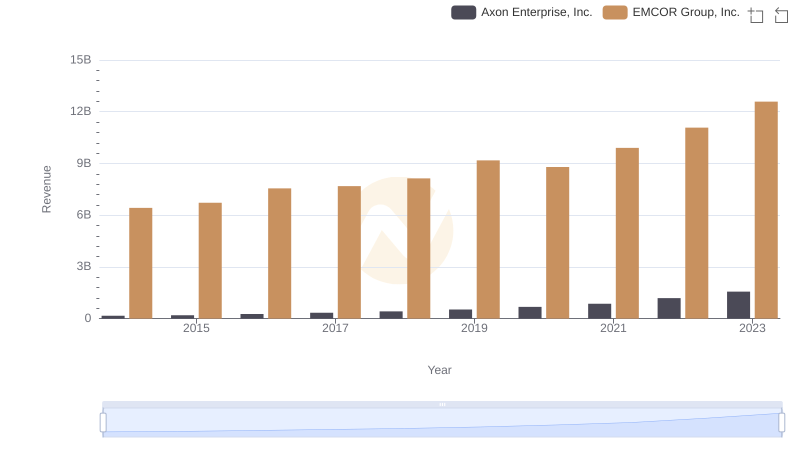
Comparing Revenue Performance: Axon Enterprise, Inc. or EMCOR Group, Inc.?
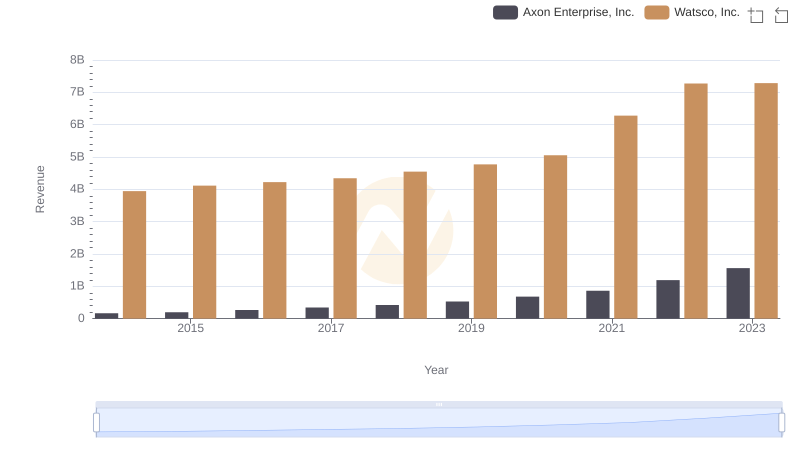
Axon Enterprise, Inc. vs Watsco, Inc.: Examining Key Revenue Metrics
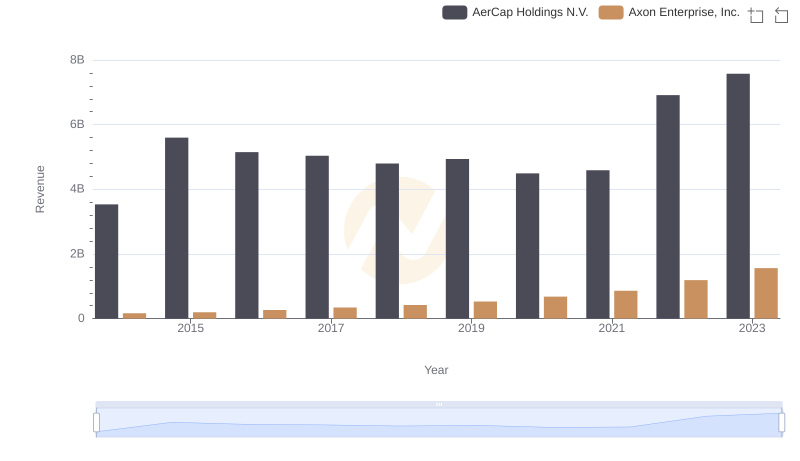
Comparing Revenue Performance: Axon Enterprise, Inc. or AerCap Holdings N.V.?
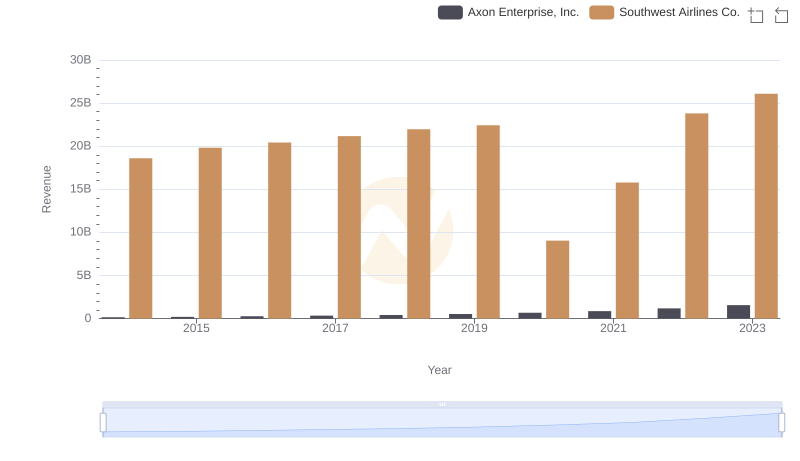
Revenue Showdown: Axon Enterprise, Inc. vs Southwest Airlines Co.
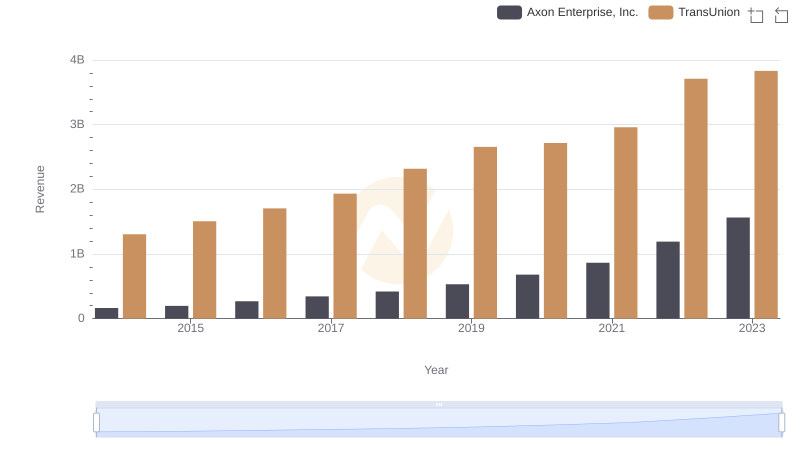
Breaking Down Revenue Trends: Axon Enterprise, Inc. vs TransUnion
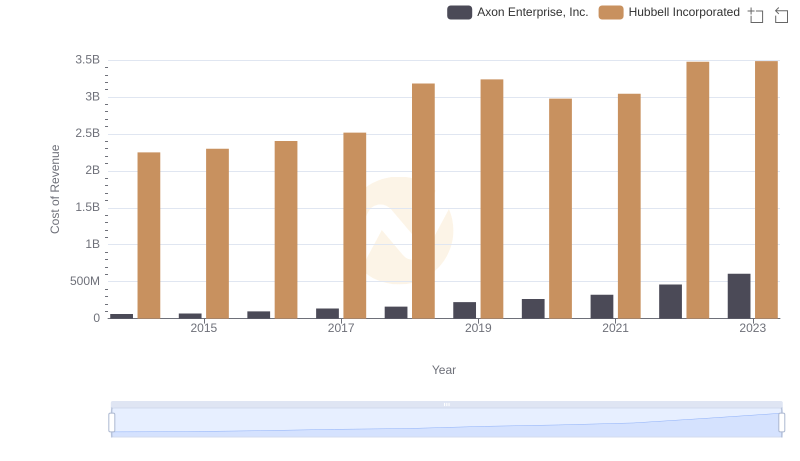
Analyzing Cost of Revenue: Axon Enterprise, Inc. and Hubbell Incorporated
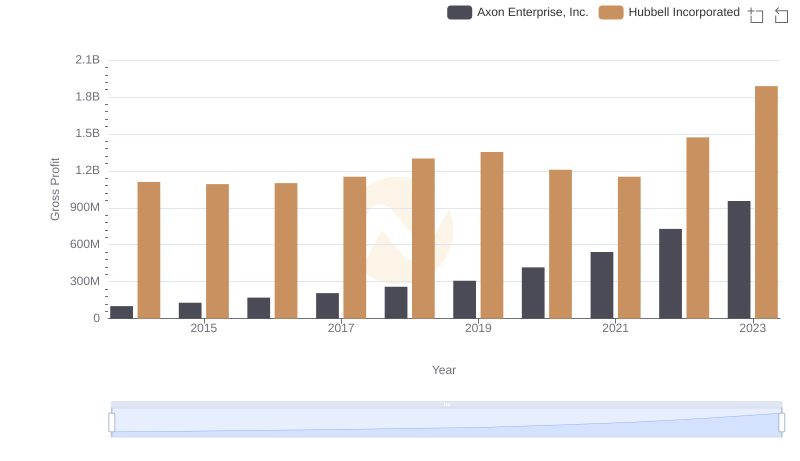
Key Insights on Gross Profit: Axon Enterprise, Inc. vs Hubbell Incorporated