| __timestamp | Comfort Systems USA, Inc. | United Rentals, Inc. |
|---|---|---|
| Wednesday, January 1, 2014 | 63455000 | 1678000000 |
| Thursday, January 1, 2015 | 112580000 | 2653000000 |
| Friday, January 1, 2016 | 126974000 | 2566000000 |
| Sunday, January 1, 2017 | 137151000 | 2843000000 |
| Monday, January 1, 2018 | 191982000 | 3628000000 |
| Tuesday, January 1, 2019 | 229518000 | 4200000000 |
| Wednesday, January 1, 2020 | 276904000 | 2195000000 |
| Friday, January 1, 2021 | 282506000 | 2642000000 |
| Saturday, January 1, 2022 | 352446000 | 5464000000 |
| Sunday, January 1, 2023 | 497652000 | 6627000000 |
| Monday, January 1, 2024 | 4516000000 |
In pursuit of knowledge
In the ever-evolving landscape of the construction and services industry, EBITDA serves as a crucial indicator of financial health and operational efficiency. From 2014 to 2023, United Rentals, Inc. has consistently outperformed Comfort Systems USA, Inc. in terms of EBITDA. United Rentals saw a staggering growth of nearly 295% over this period, peaking at approximately $6.6 billion in 2023. In contrast, Comfort Systems USA experienced a more modest growth of around 684%, reaching nearly $498 million in the same year. This disparity highlights United Rentals' robust market position and strategic investments. However, Comfort Systems USA's steady growth trajectory suggests a promising future. Notably, the data for 2024 shows a decline for United Rentals, indicating potential market challenges or strategic shifts. Missing data for Comfort Systems USA in 2024 leaves room for speculation about its future performance.
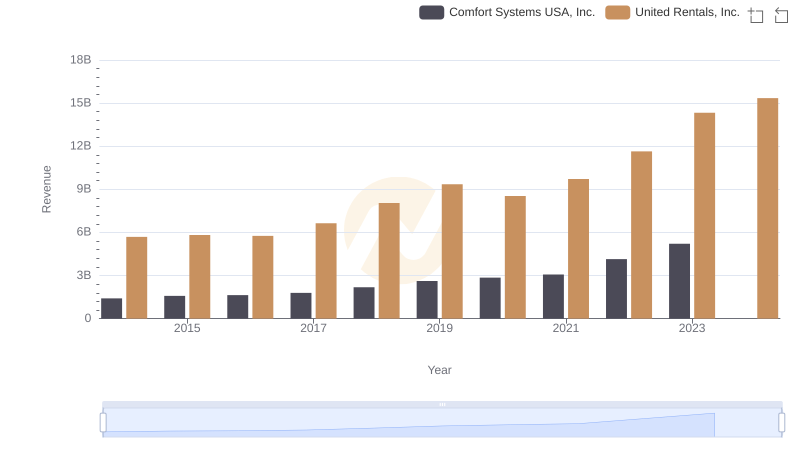
Breaking Down Revenue Trends: United Rentals, Inc. vs Comfort Systems USA, Inc.
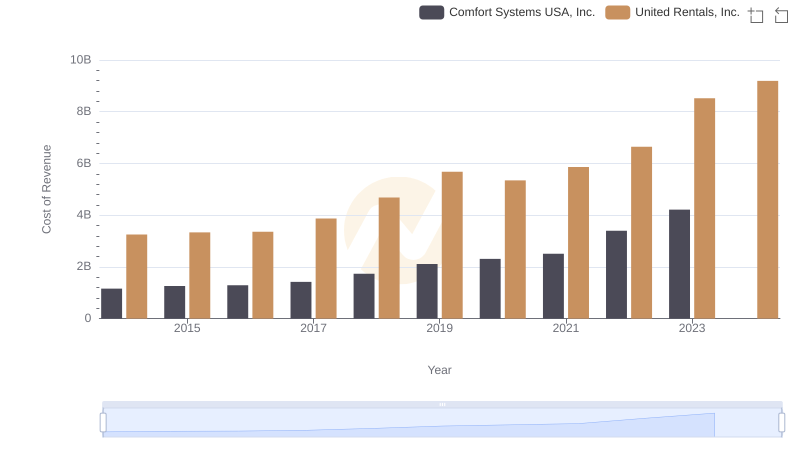
Cost of Revenue Trends: United Rentals, Inc. vs Comfort Systems USA, Inc.
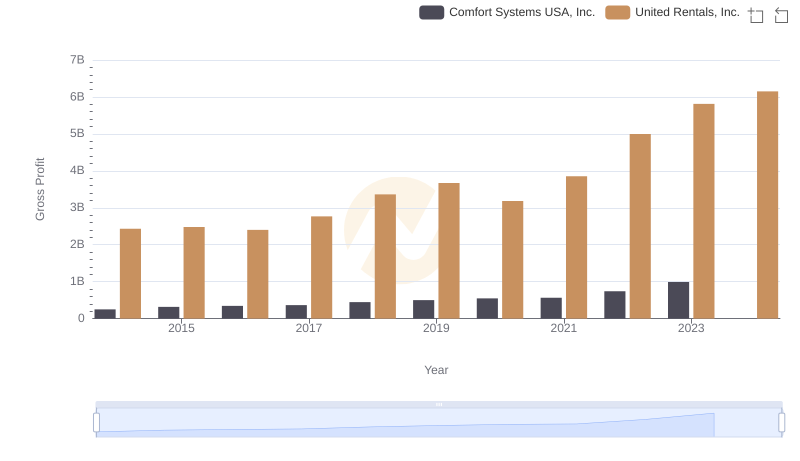
Gross Profit Trends Compared: United Rentals, Inc. vs Comfort Systems USA, Inc.
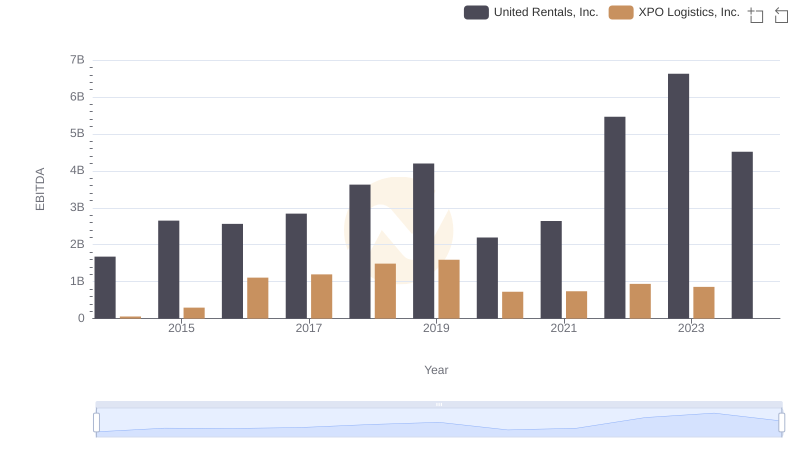
EBITDA Performance Review: United Rentals, Inc. vs XPO Logistics, Inc.
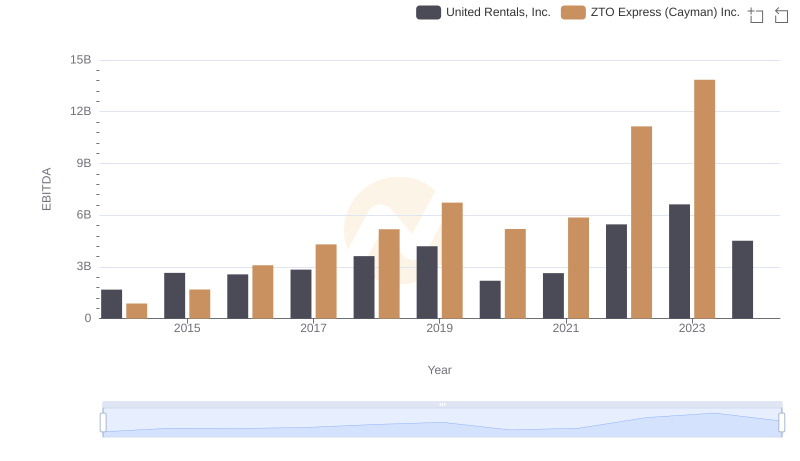
Comparative EBITDA Analysis: United Rentals, Inc. vs ZTO Express (Cayman) Inc.
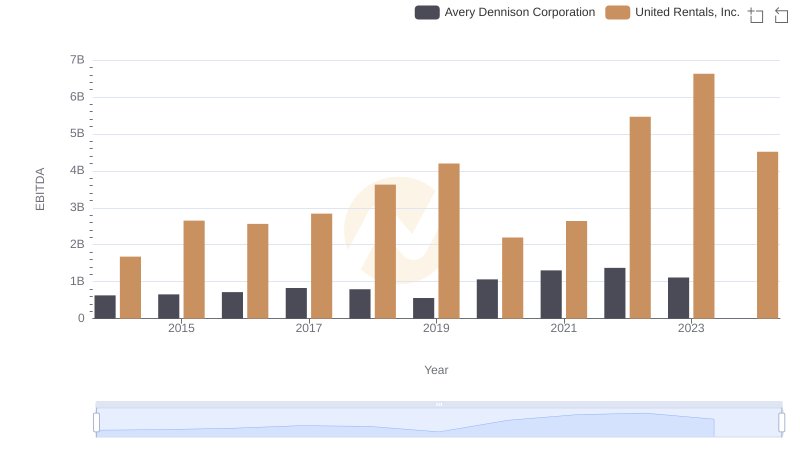
Comparative EBITDA Analysis: United Rentals, Inc. vs Avery Dennison Corporation
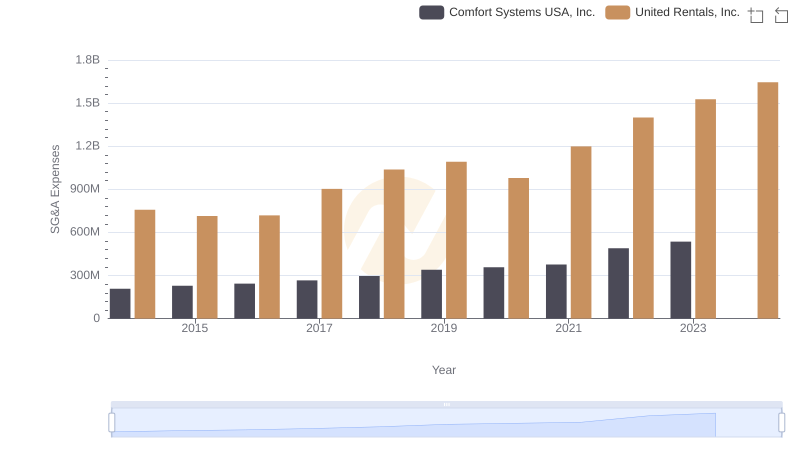
United Rentals, Inc. and Comfort Systems USA, Inc.: SG&A Spending Patterns Compared
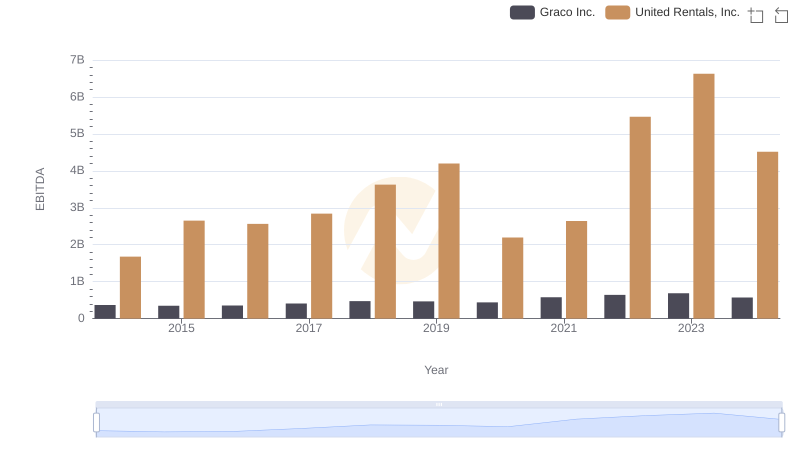
EBITDA Analysis: Evaluating United Rentals, Inc. Against Graco Inc.
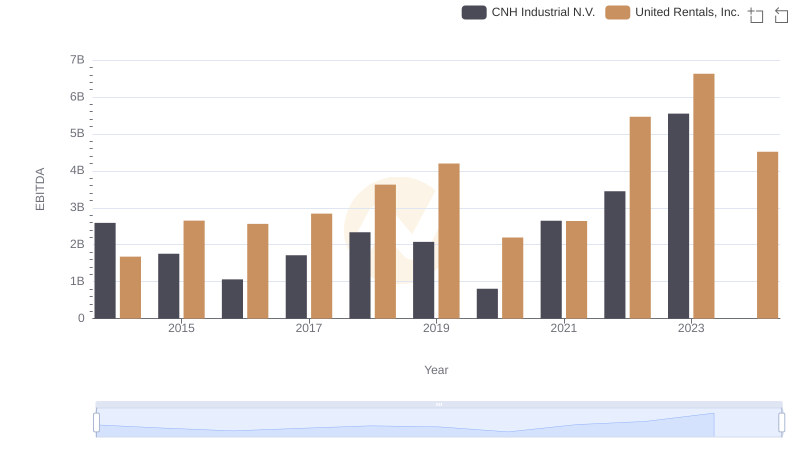
Comprehensive EBITDA Comparison: United Rentals, Inc. vs CNH Industrial N.V.
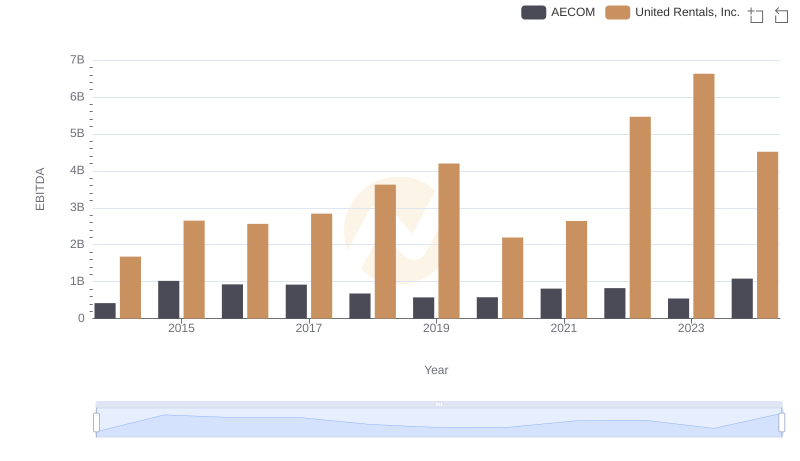
A Professional Review of EBITDA: United Rentals, Inc. Compared to AECOM
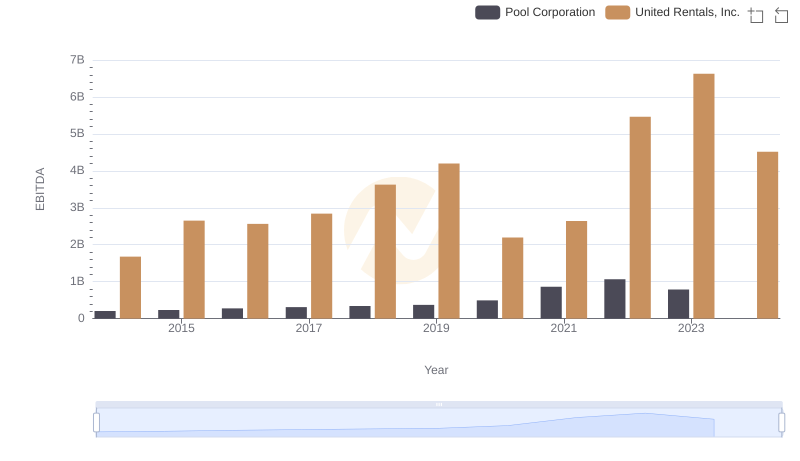
Comparative EBITDA Analysis: United Rentals, Inc. vs Pool Corporation

Comprehensive EBITDA Comparison: United Rentals, Inc. vs Stanley Black & Decker, Inc.