| __timestamp | Comfort Systems USA, Inc. | United Rentals, Inc. |
|---|---|---|
| Wednesday, January 1, 2014 | 1410795000 | 5685000000 |
| Thursday, January 1, 2015 | 1580519000 | 5817000000 |
| Friday, January 1, 2016 | 1634340000 | 5762000000 |
| Sunday, January 1, 2017 | 1787922000 | 6641000000 |
| Monday, January 1, 2018 | 2182879000 | 8047000000 |
| Tuesday, January 1, 2019 | 2615277000 | 9351000000 |
| Wednesday, January 1, 2020 | 2856659000 | 8530000000 |
| Friday, January 1, 2021 | 3073636000 | 9716000000 |
| Saturday, January 1, 2022 | 4140364000 | 11642000000 |
| Sunday, January 1, 2023 | 5206760000 | 14332000000 |
| Monday, January 1, 2024 | 15345000000 |
Infusing magic into the data realm
In the competitive landscape of the equipment rental and building services industries, United Rentals, Inc. and Comfort Systems USA, Inc. have shown remarkable revenue trajectories over the past decade. Since 2014, United Rentals has consistently outpaced Comfort Systems, with a revenue increase of approximately 170% by 2023. Comfort Systems, while trailing, has demonstrated a robust growth of nearly 270% in the same period.
The data for 2024 is incomplete, but the trends suggest continued growth for both companies.
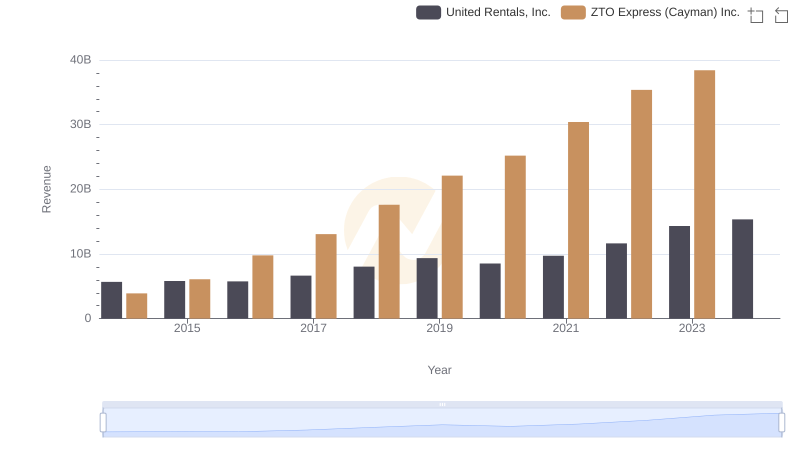
United Rentals, Inc. and ZTO Express (Cayman) Inc.: A Comprehensive Revenue Analysis
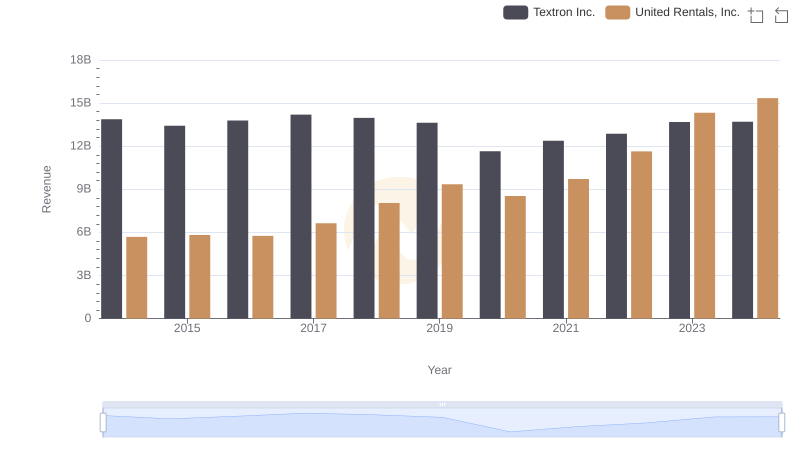
Revenue Insights: United Rentals, Inc. and Textron Inc. Performance Compared
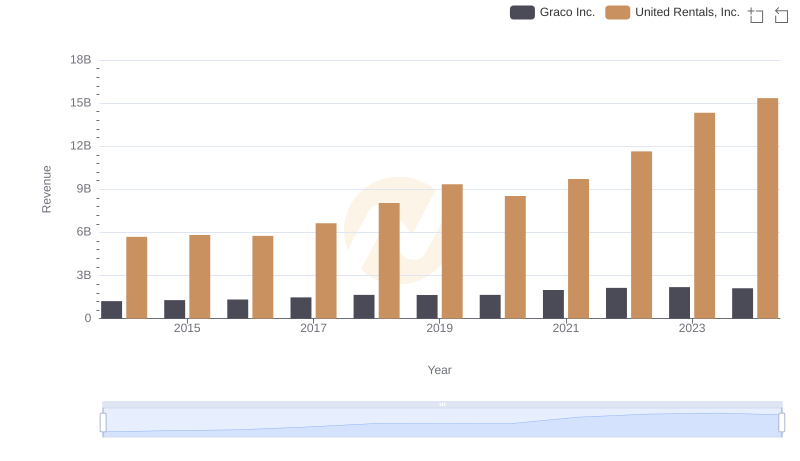
Who Generates More Revenue? United Rentals, Inc. or Graco Inc.
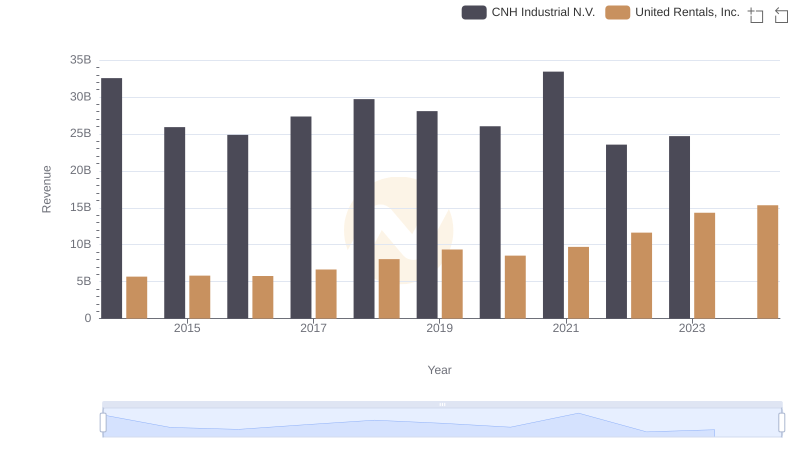
United Rentals, Inc. or CNH Industrial N.V.: Who Leads in Yearly Revenue?
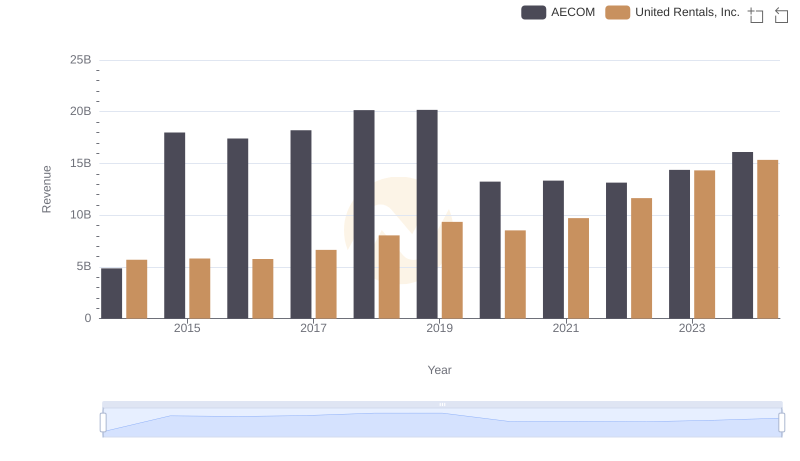
United Rentals, Inc. or AECOM: Who Leads in Yearly Revenue?

Breaking Down Revenue Trends: United Rentals, Inc. vs Stanley Black & Decker, Inc.
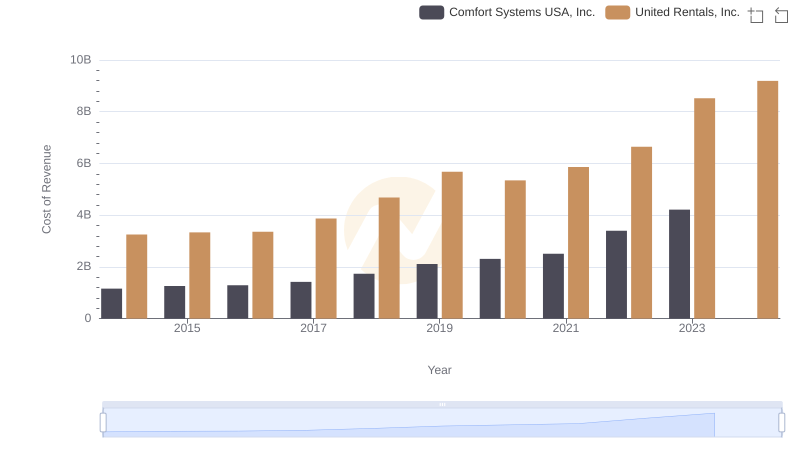
Cost of Revenue Trends: United Rentals, Inc. vs Comfort Systems USA, Inc.
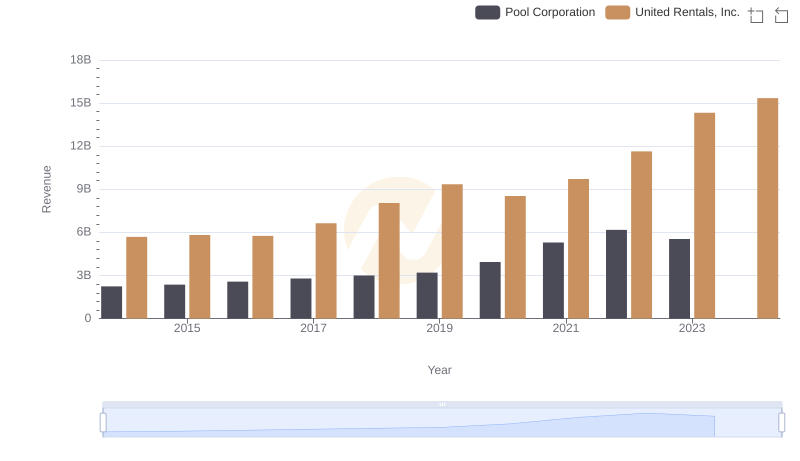
Annual Revenue Comparison: United Rentals, Inc. vs Pool Corporation

Breaking Down Revenue Trends: United Rentals, Inc. vs Saia, Inc.
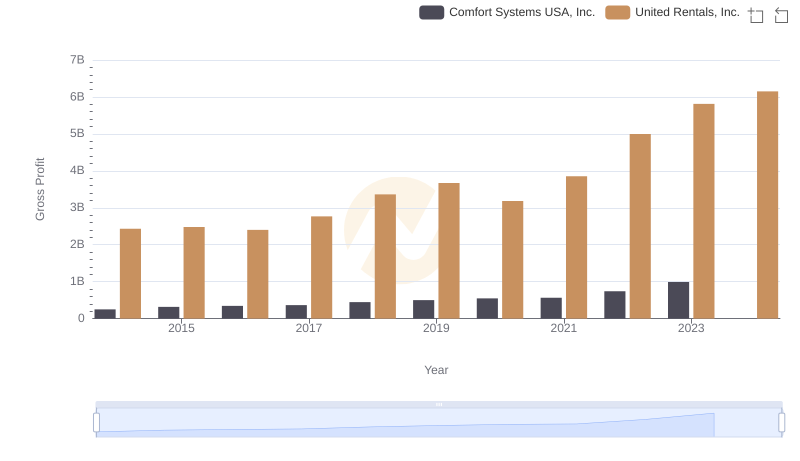
Gross Profit Trends Compared: United Rentals, Inc. vs Comfort Systems USA, Inc.
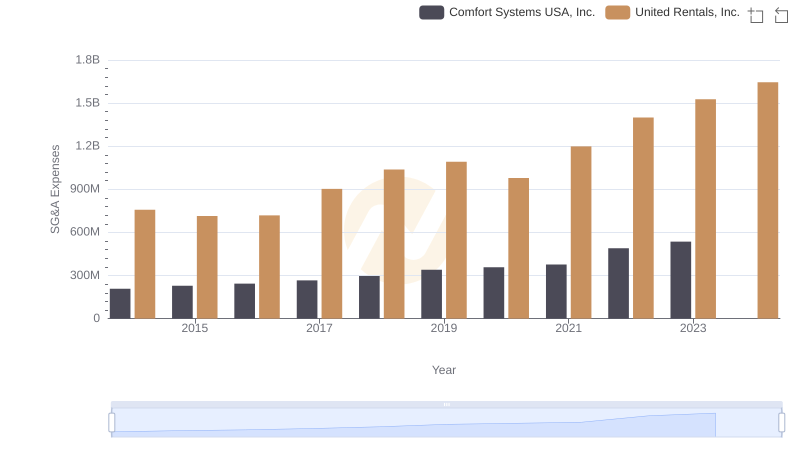
United Rentals, Inc. and Comfort Systems USA, Inc.: SG&A Spending Patterns Compared
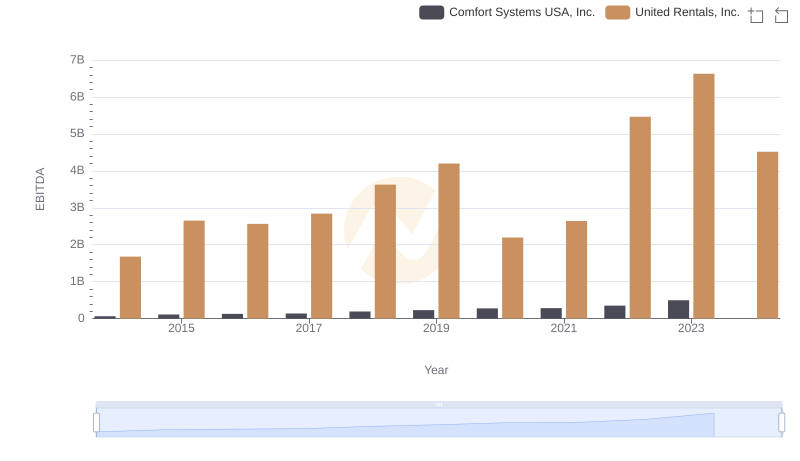
A Side-by-Side Analysis of EBITDA: United Rentals, Inc. and Comfort Systems USA, Inc.