| __timestamp | Avery Dennison Corporation | United Rentals, Inc. |
|---|---|---|
| Wednesday, January 1, 2014 | 629200000 | 1678000000 |
| Thursday, January 1, 2015 | 657700000 | 2653000000 |
| Friday, January 1, 2016 | 717000000 | 2566000000 |
| Sunday, January 1, 2017 | 829400000 | 2843000000 |
| Monday, January 1, 2018 | 794300000 | 3628000000 |
| Tuesday, January 1, 2019 | 557500000 | 4200000000 |
| Wednesday, January 1, 2020 | 1062000000 | 2195000000 |
| Friday, January 1, 2021 | 1306900000 | 2642000000 |
| Saturday, January 1, 2022 | 1374100000 | 5464000000 |
| Sunday, January 1, 2023 | 1112100000 | 6627000000 |
| Monday, January 1, 2024 | 1382700000 | 4516000000 |
Unleashing insights
In the ever-evolving landscape of industrial and manufacturing sectors, United Rentals, Inc. and Avery Dennison Corporation have showcased remarkable financial trajectories over the past decade. From 2014 to 2023, United Rentals has consistently outperformed Avery Dennison in terms of EBITDA, reflecting a robust growth strategy and market adaptability.
United Rentals' EBITDA surged by nearly 295% from 2014 to 2023, peaking at an impressive $6.63 billion in 2023. This growth underscores the company's strategic expansions and operational efficiencies. In contrast, Avery Dennison's EBITDA, while showing a steady increase, grew by approximately 77% over the same period, reaching $1.37 billion in 2022 before a slight dip in 2023.
The data highlights the dynamic nature of these industries and the importance of strategic planning in achieving financial success. Missing data for 2024 suggests a need for cautious optimism as both companies navigate future challenges.
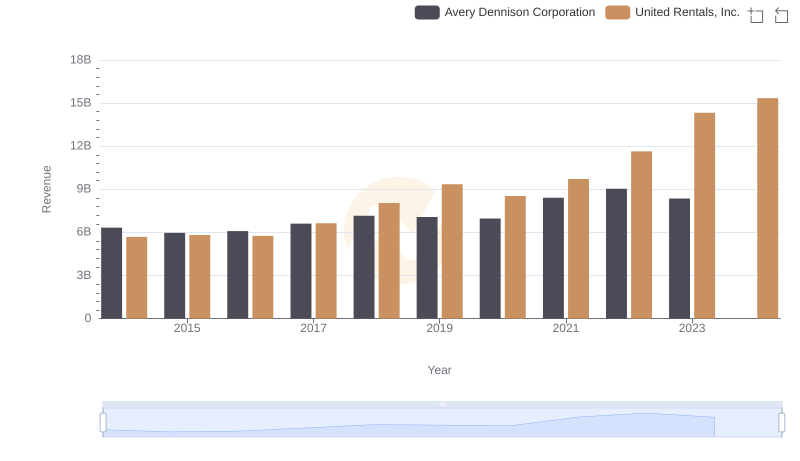
United Rentals, Inc. vs Avery Dennison Corporation: Examining Key Revenue Metrics
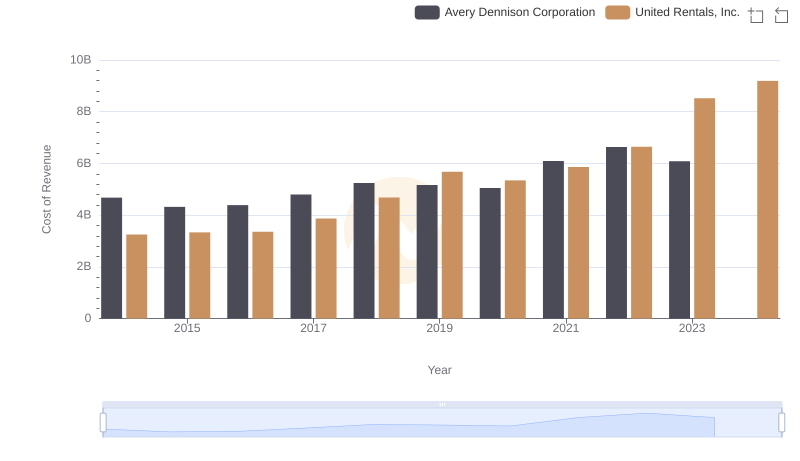
Analyzing Cost of Revenue: United Rentals, Inc. and Avery Dennison Corporation

United Rentals, Inc. and Avery Dennison Corporation: A Detailed Gross Profit Analysis
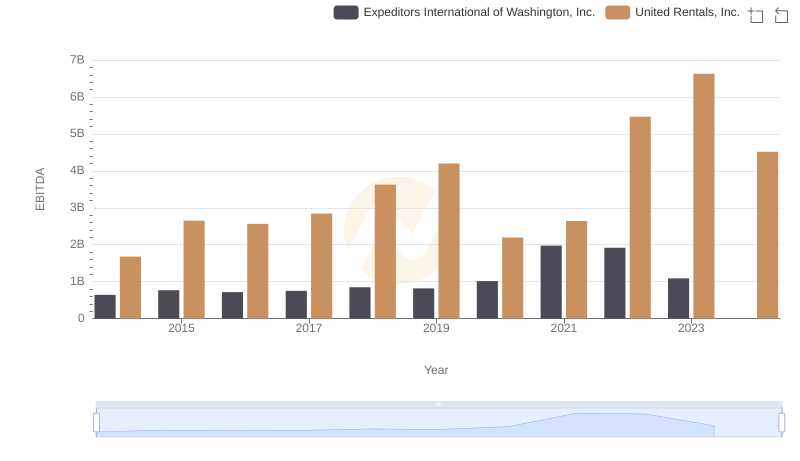
A Side-by-Side Analysis of EBITDA: United Rentals, Inc. and Expeditors International of Washington, Inc.

United Rentals, Inc. vs Owens Corning: In-Depth EBITDA Performance Comparison
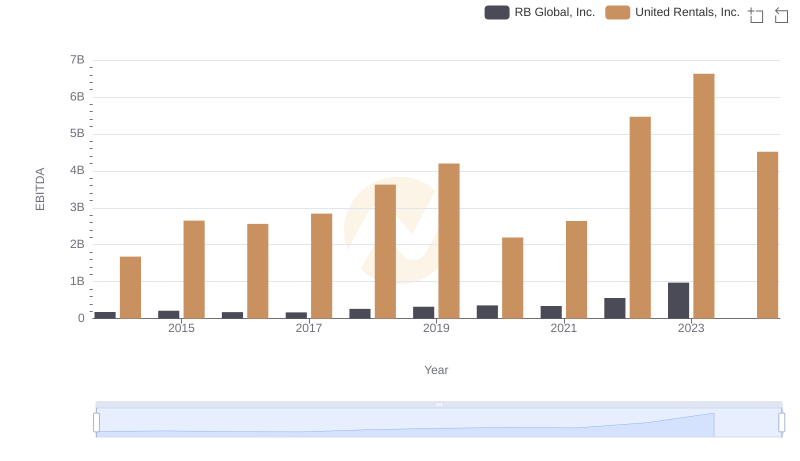
Comprehensive EBITDA Comparison: United Rentals, Inc. vs RB Global, Inc.
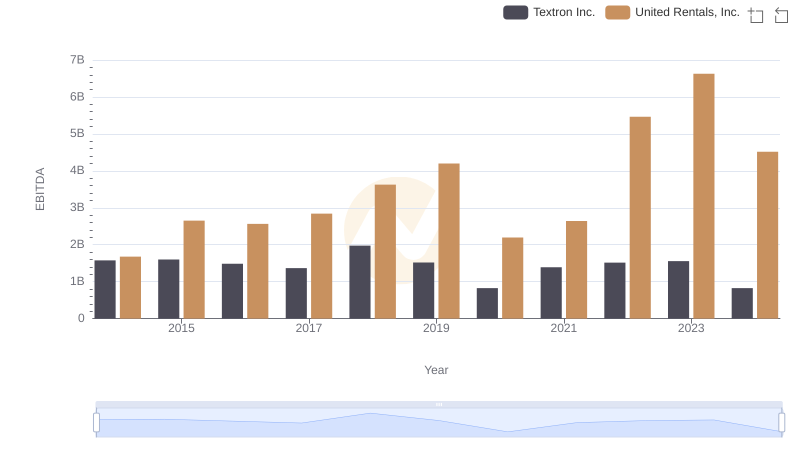
United Rentals, Inc. vs Textron Inc.: In-Depth EBITDA Performance Comparison
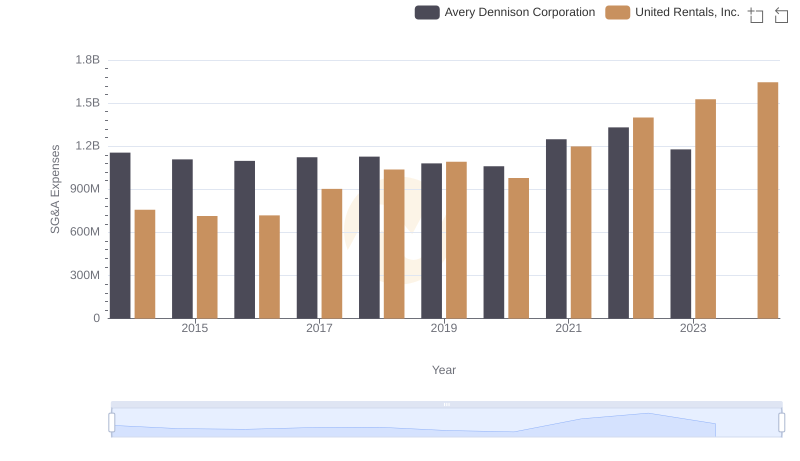
United Rentals, Inc. or Avery Dennison Corporation: Who Manages SG&A Costs Better?
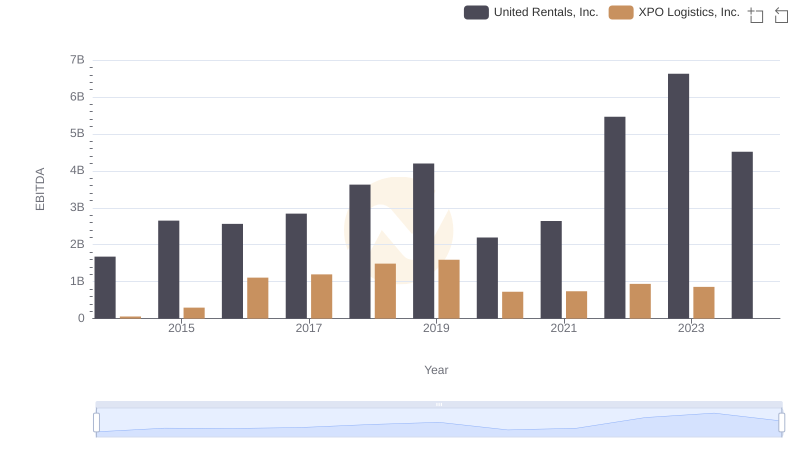
EBITDA Performance Review: United Rentals, Inc. vs XPO Logistics, Inc.
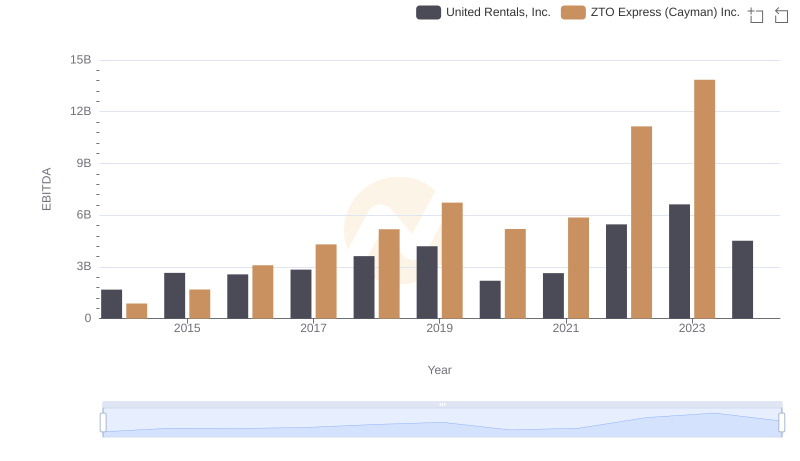
Comparative EBITDA Analysis: United Rentals, Inc. vs ZTO Express (Cayman) Inc.
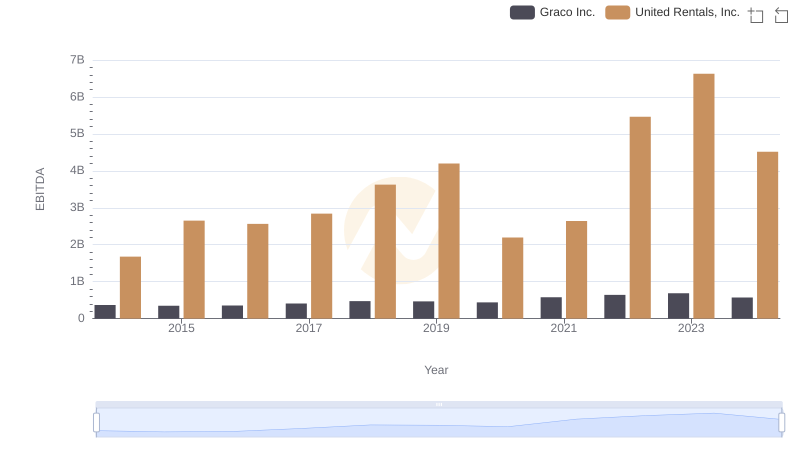
EBITDA Analysis: Evaluating United Rentals, Inc. Against Graco Inc.
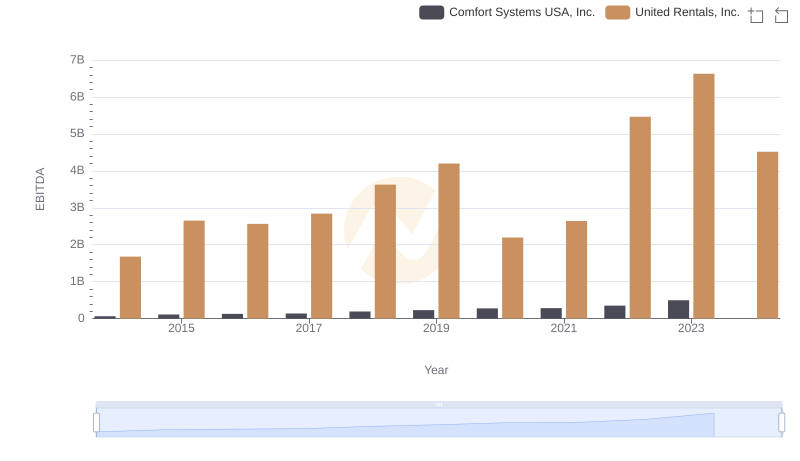
A Side-by-Side Analysis of EBITDA: United Rentals, Inc. and Comfort Systems USA, Inc.