| __timestamp | United Rentals, Inc. | XPO Logistics, Inc. |
|---|---|---|
| Wednesday, January 1, 2014 | 1678000000 | 56600000 |
| Thursday, January 1, 2015 | 2653000000 | 298000000 |
| Friday, January 1, 2016 | 2566000000 | 1108300000 |
| Sunday, January 1, 2017 | 2843000000 | 1196700000 |
| Monday, January 1, 2018 | 3628000000 | 1488000000 |
| Tuesday, January 1, 2019 | 4200000000 | 1594000000 |
| Wednesday, January 1, 2020 | 2195000000 | 727000000 |
| Friday, January 1, 2021 | 2642000000 | 741000000 |
| Saturday, January 1, 2022 | 5464000000 | 941000000 |
| Sunday, January 1, 2023 | 6627000000 | 860000000 |
| Monday, January 1, 2024 | 4516000000 | 1186000000 |
Unlocking the unknown
In the competitive landscape of industrial services and logistics, United Rentals, Inc. and XPO Logistics, Inc. have showcased intriguing EBITDA trends over the past decade. United Rentals, a leader in equipment rental, has seen its EBITDA grow by nearly 295% from 2014 to 2023, peaking in 2023 with a remarkable 6.6 billion. This growth underscores its strategic expansions and market dominance.
Conversely, XPO Logistics, a key player in transportation and logistics, experienced a more modest EBITDA increase of approximately 1,417% from 2014 to 2019, before facing fluctuations. Notably, XPO's EBITDA reached its zenith in 2019, followed by a decline, highlighting the challenges in the logistics sector.
The data for 2024 remains incomplete, offering a glimpse into the uncertainties both companies face. As these industry titans navigate economic shifts, their EBITDA trajectories provide valuable insights into their operational strategies and market resilience.
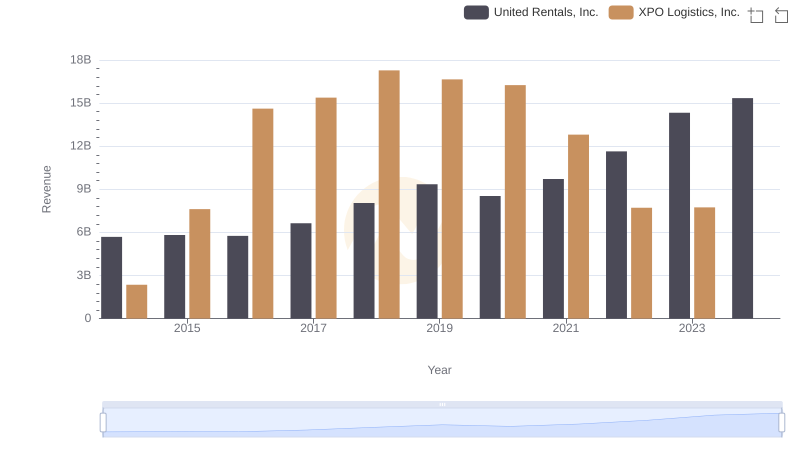
United Rentals, Inc. and XPO Logistics, Inc.: A Comprehensive Revenue Analysis
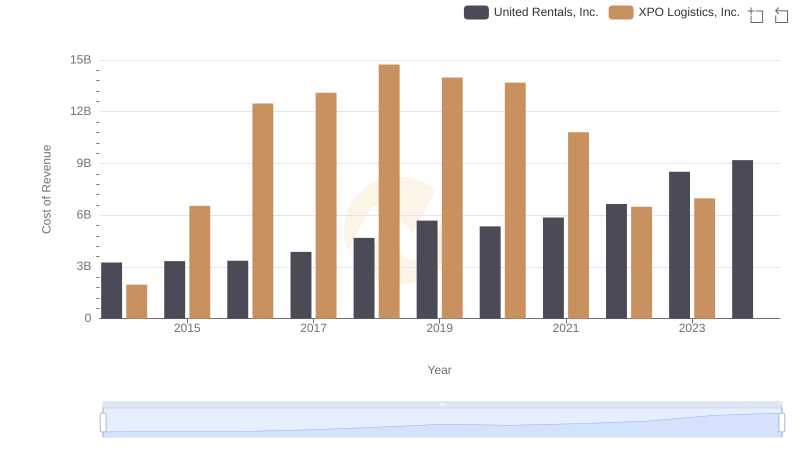
Cost of Revenue Trends: United Rentals, Inc. vs XPO Logistics, Inc.
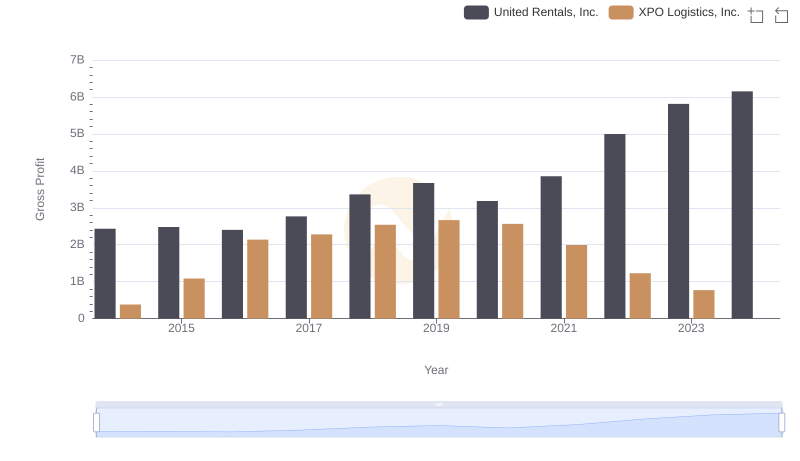
United Rentals, Inc. vs XPO Logistics, Inc.: A Gross Profit Performance Breakdown
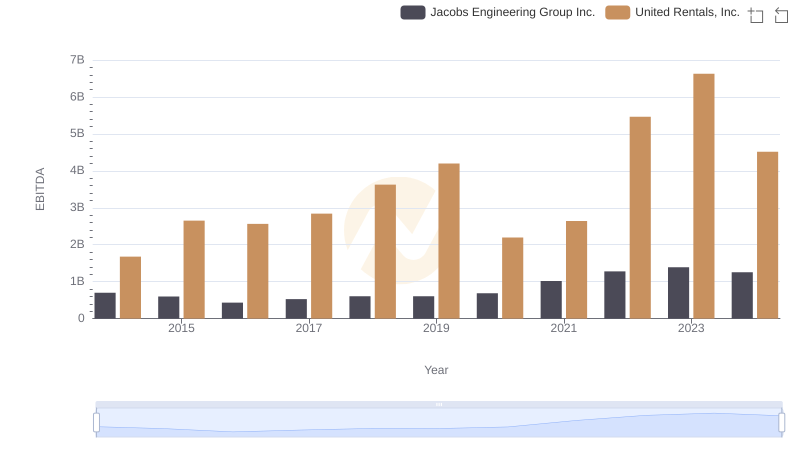
EBITDA Performance Review: United Rentals, Inc. vs Jacobs Engineering Group Inc.
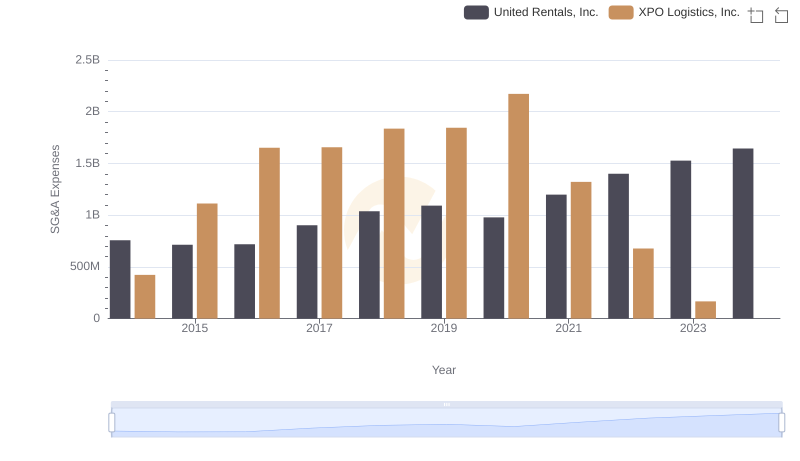
Operational Costs Compared: SG&A Analysis of United Rentals, Inc. and XPO Logistics, Inc.
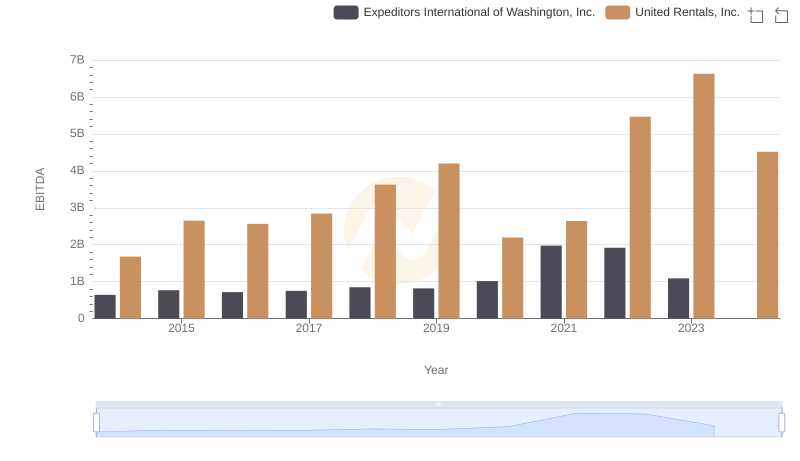
A Side-by-Side Analysis of EBITDA: United Rentals, Inc. and Expeditors International of Washington, Inc.

United Rentals, Inc. vs Owens Corning: In-Depth EBITDA Performance Comparison
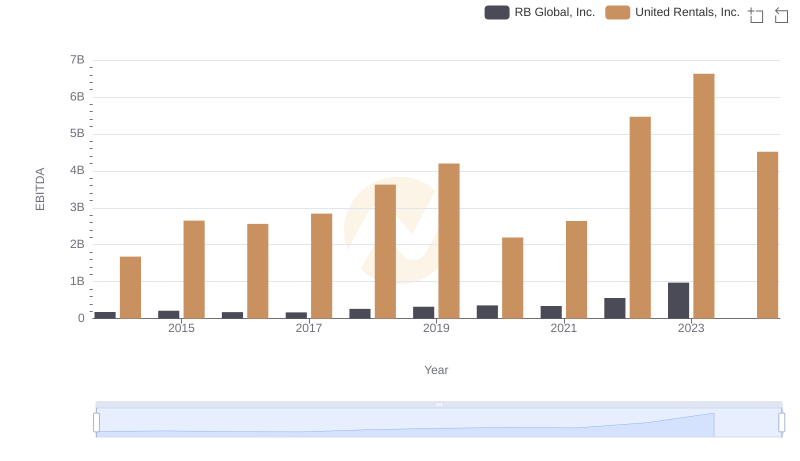
Comprehensive EBITDA Comparison: United Rentals, Inc. vs RB Global, Inc.
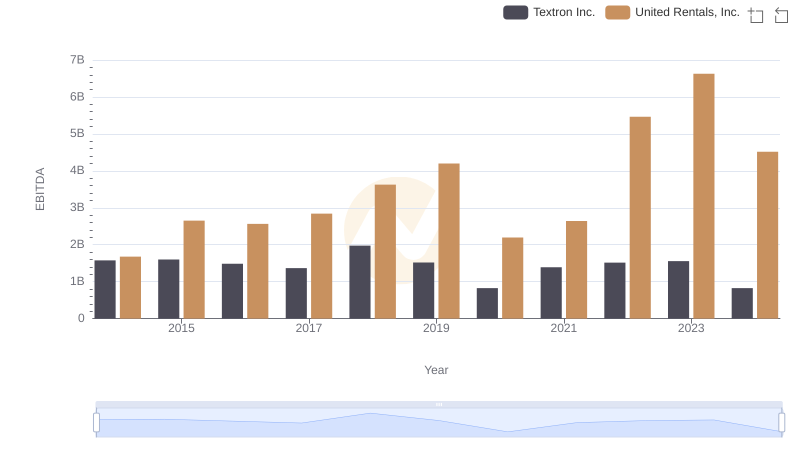
United Rentals, Inc. vs Textron Inc.: In-Depth EBITDA Performance Comparison
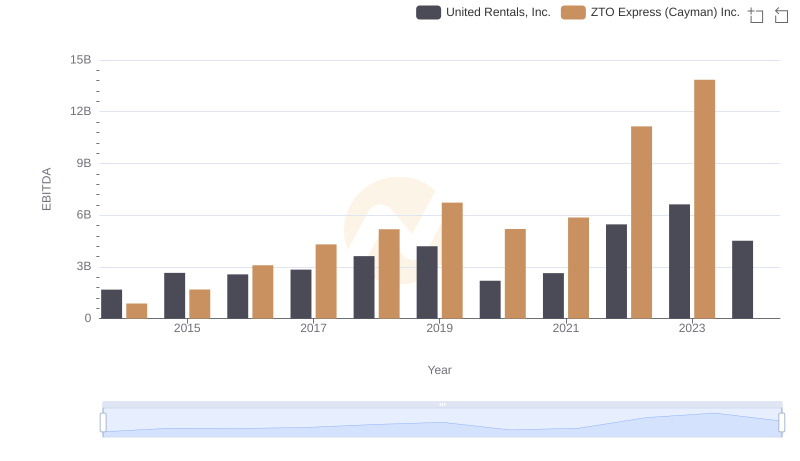
Comparative EBITDA Analysis: United Rentals, Inc. vs ZTO Express (Cayman) Inc.
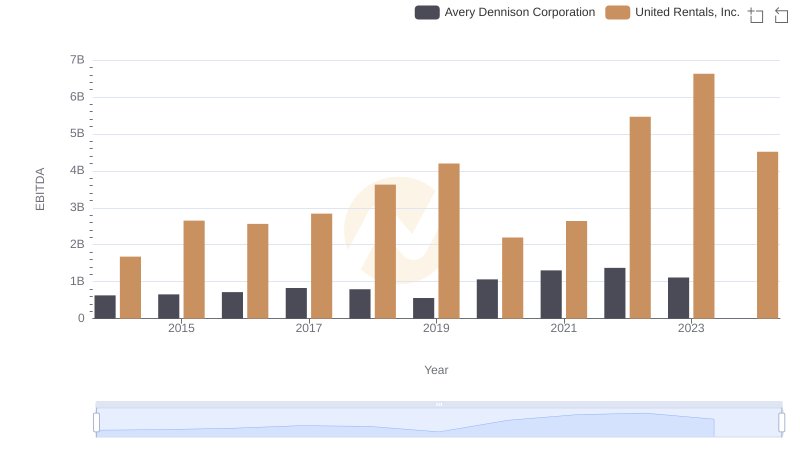
Comparative EBITDA Analysis: United Rentals, Inc. vs Avery Dennison Corporation
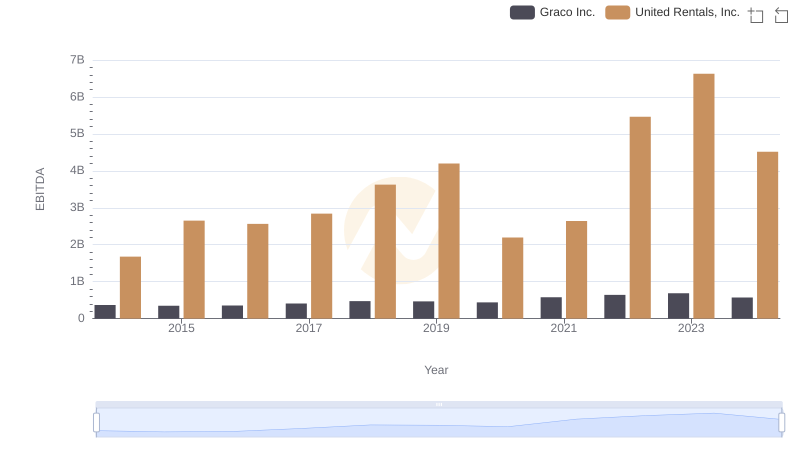
EBITDA Analysis: Evaluating United Rentals, Inc. Against Graco Inc.