| __timestamp | Comfort Systems USA, Inc. | United Rentals, Inc. |
|---|---|---|
| Wednesday, January 1, 2014 | 207652000 | 758000000 |
| Thursday, January 1, 2015 | 228965000 | 714000000 |
| Friday, January 1, 2016 | 243201000 | 719000000 |
| Sunday, January 1, 2017 | 266586000 | 903000000 |
| Monday, January 1, 2018 | 296986000 | 1038000000 |
| Tuesday, January 1, 2019 | 340005000 | 1092000000 |
| Wednesday, January 1, 2020 | 357777000 | 979000000 |
| Friday, January 1, 2021 | 376309000 | 1199000000 |
| Saturday, January 1, 2022 | 489344000 | 1400000000 |
| Sunday, January 1, 2023 | 536188999 | 1527000000 |
| Monday, January 1, 2024 | 1645000000 |
Igniting the spark of knowledge
In the ever-evolving landscape of corporate finance, understanding the spending patterns of industry leaders can offer valuable insights. Over the past decade, United Rentals, Inc. and Comfort Systems USA, Inc. have demonstrated distinct trends in their Selling, General, and Administrative (SG&A) expenses. From 2014 to 2023, United Rentals saw a steady increase in SG&A expenses, peaking at approximately 1.53 billion in 2023, marking a 102% rise from 2014. In contrast, Comfort Systems USA experienced a more moderate growth, with expenses increasing by 158% over the same period, reaching around 536 million in 2023. This divergence highlights the strategic differences in operational management between the two companies. Notably, the data for 2024 is incomplete, leaving room for speculation on future trends. As businesses navigate economic challenges, these spending patterns may offer a glimpse into their adaptive strategies.
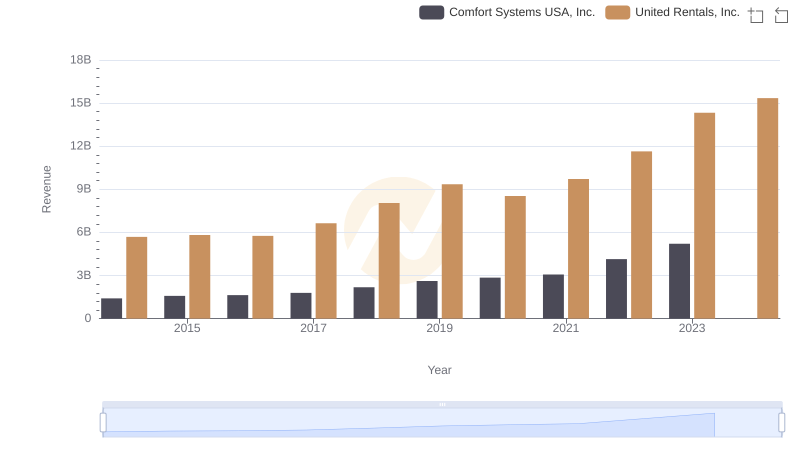
Breaking Down Revenue Trends: United Rentals, Inc. vs Comfort Systems USA, Inc.
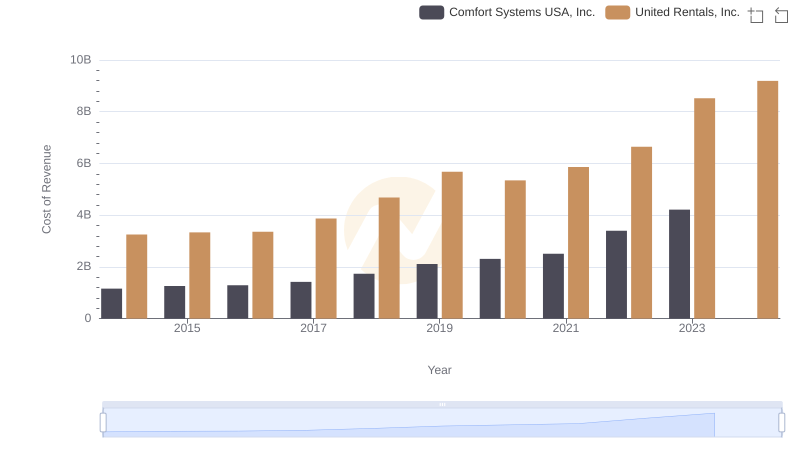
Cost of Revenue Trends: United Rentals, Inc. vs Comfort Systems USA, Inc.
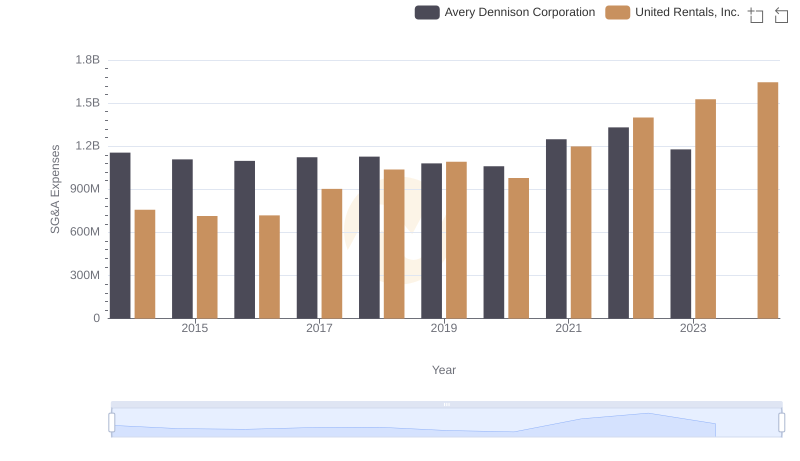
United Rentals, Inc. or Avery Dennison Corporation: Who Manages SG&A Costs Better?
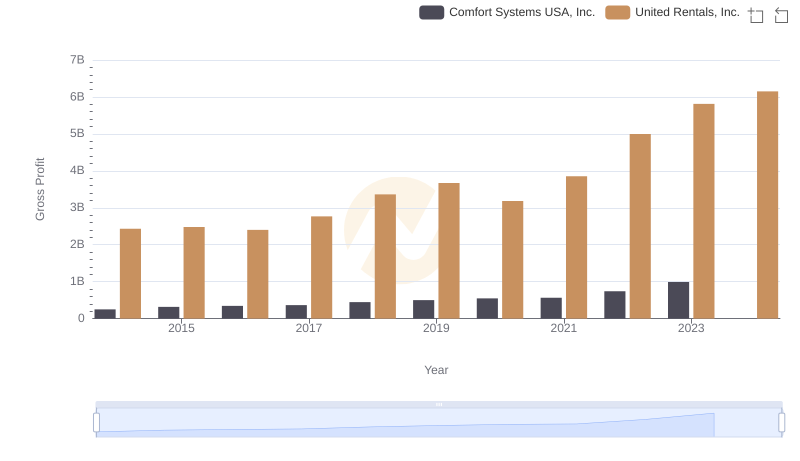
Gross Profit Trends Compared: United Rentals, Inc. vs Comfort Systems USA, Inc.
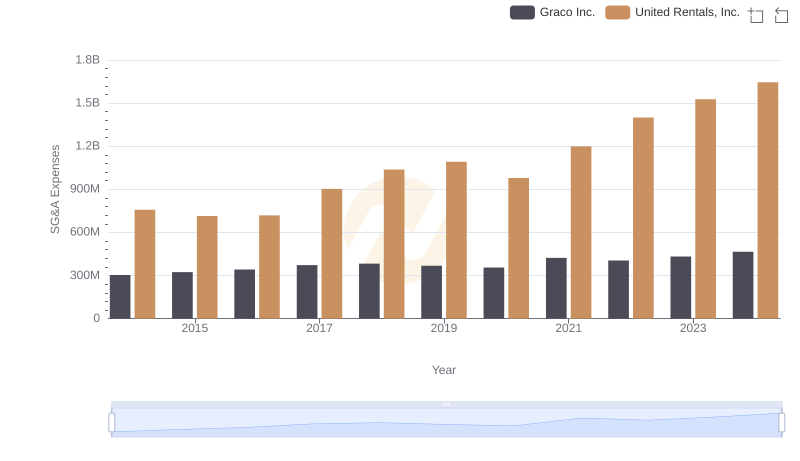
SG&A Efficiency Analysis: Comparing United Rentals, Inc. and Graco Inc.
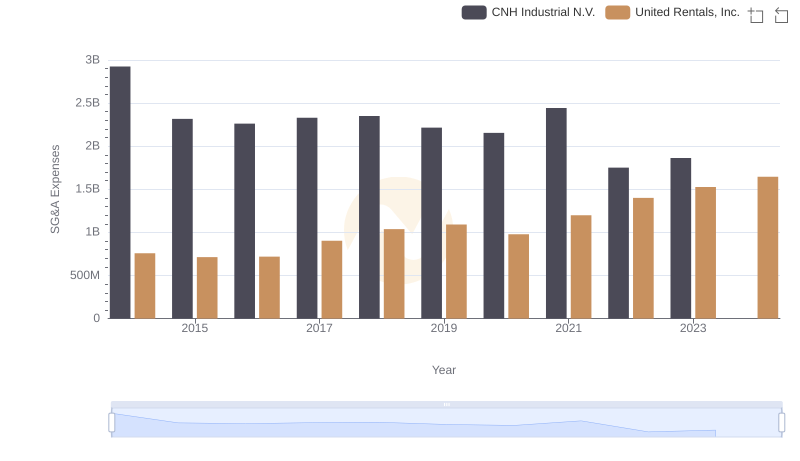
United Rentals, Inc. vs CNH Industrial N.V.: SG&A Expense Trends
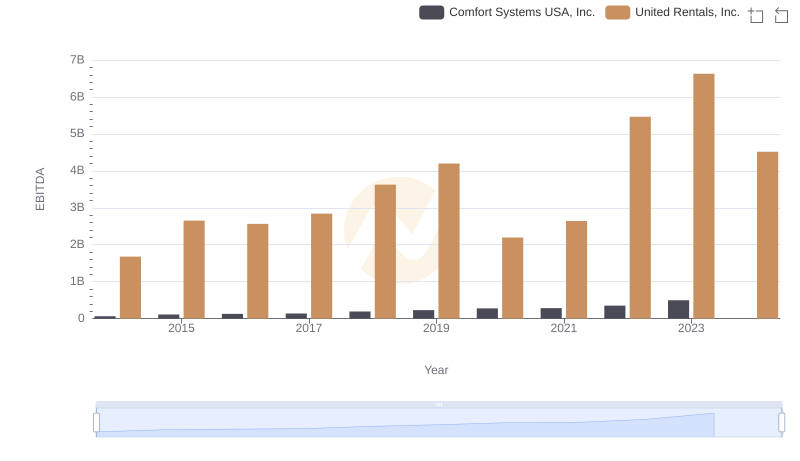
A Side-by-Side Analysis of EBITDA: United Rentals, Inc. and Comfort Systems USA, Inc.
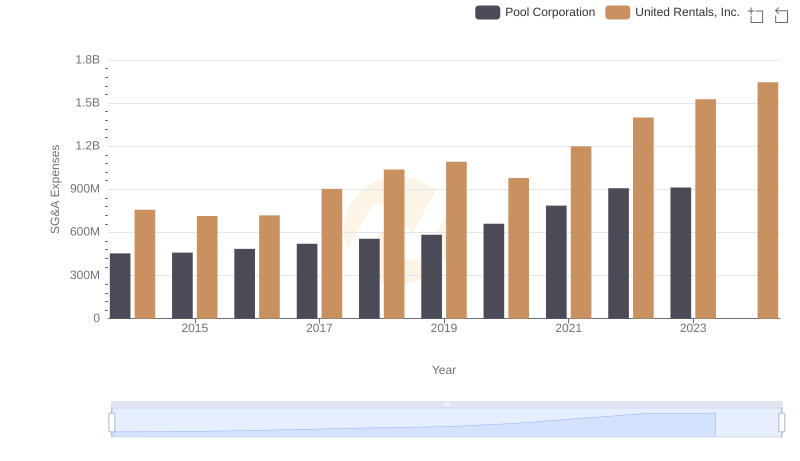
Cost Management Insights: SG&A Expenses for United Rentals, Inc. and Pool Corporation
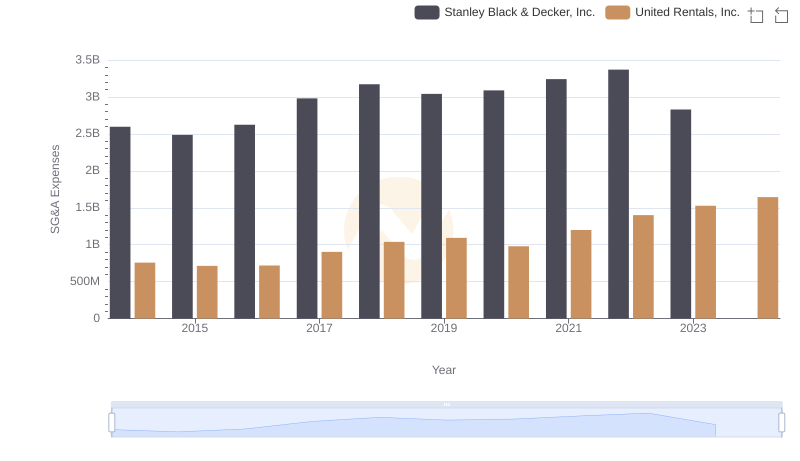
Cost Management Insights: SG&A Expenses for United Rentals, Inc. and Stanley Black & Decker, Inc.
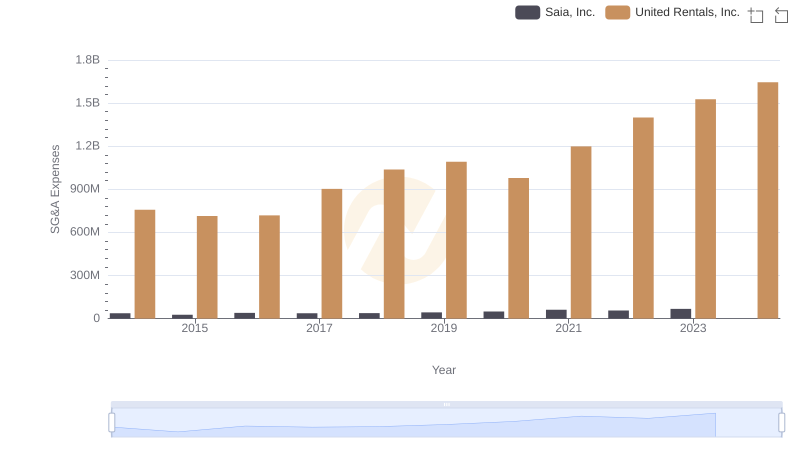
Breaking Down SG&A Expenses: United Rentals, Inc. vs Saia, Inc.