| __timestamp | United Rentals, Inc. | ZTO Express (Cayman) Inc. |
|---|---|---|
| Wednesday, January 1, 2014 | 1678000000 | 876815000 |
| Thursday, January 1, 2015 | 2653000000 | 1687285000 |
| Friday, January 1, 2016 | 2566000000 | 3093956000 |
| Sunday, January 1, 2017 | 2843000000 | 4308801000 |
| Monday, January 1, 2018 | 3628000000 | 5185941000 |
| Tuesday, January 1, 2019 | 4200000000 | 6727397000 |
| Wednesday, January 1, 2020 | 2195000000 | 5197064000 |
| Friday, January 1, 2021 | 2642000000 | 5866901000 |
| Saturday, January 1, 2022 | 5464000000 | 11147519000 |
| Sunday, January 1, 2023 | 6627000000 | 13853443000 |
| Monday, January 1, 2024 | 4516000000 |
Unleashing the power of data
In the ever-evolving landscape of global business, United Rentals, Inc. and ZTO Express (Cayman) Inc. stand as titans in their respective industries. Over the past decade, these companies have showcased remarkable growth in EBITDA, a key indicator of financial health.
From 2014 to 2023, United Rentals saw its EBITDA grow by nearly 295%, peaking in 2023. Meanwhile, ZTO Express experienced an even more impressive surge, with a staggering 1,480% increase, reaching its zenith in the same year. This growth reflects the dynamic expansion strategies and market adaptability of both companies.
However, 2024 presents a curious anomaly with missing data for ZTO Express, leaving analysts speculating about potential market shifts or strategic pivots. As these industry leaders continue to evolve, their financial trajectories offer valuable insights into the broader economic trends shaping the future.
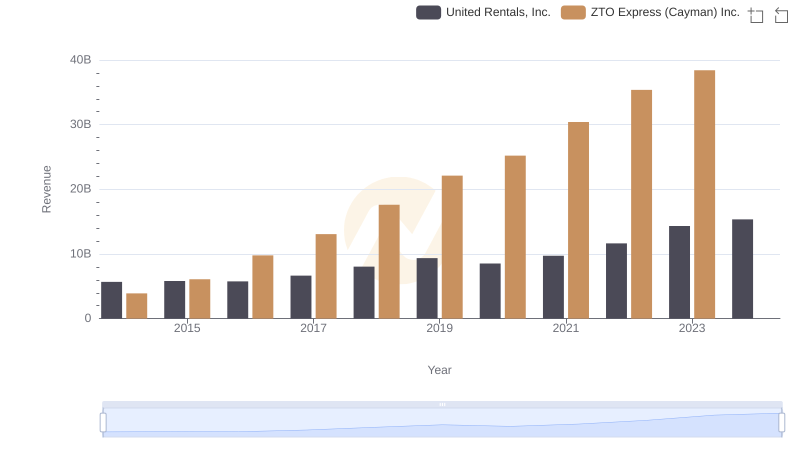
United Rentals, Inc. and ZTO Express (Cayman) Inc.: A Comprehensive Revenue Analysis
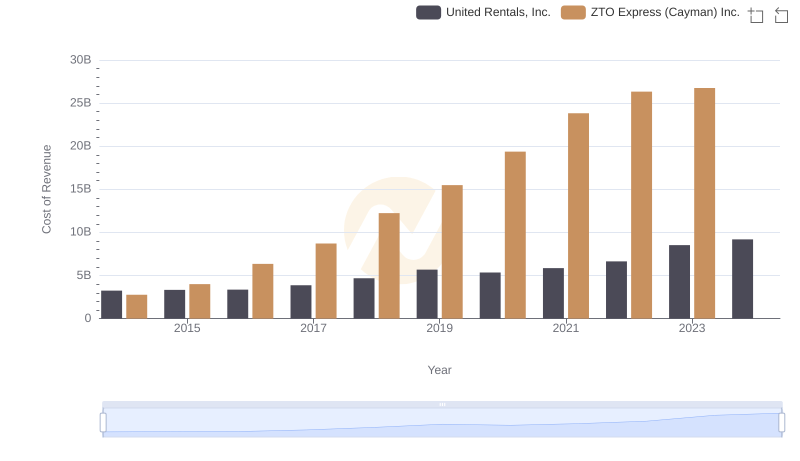
Comparing Cost of Revenue Efficiency: United Rentals, Inc. vs ZTO Express (Cayman) Inc.
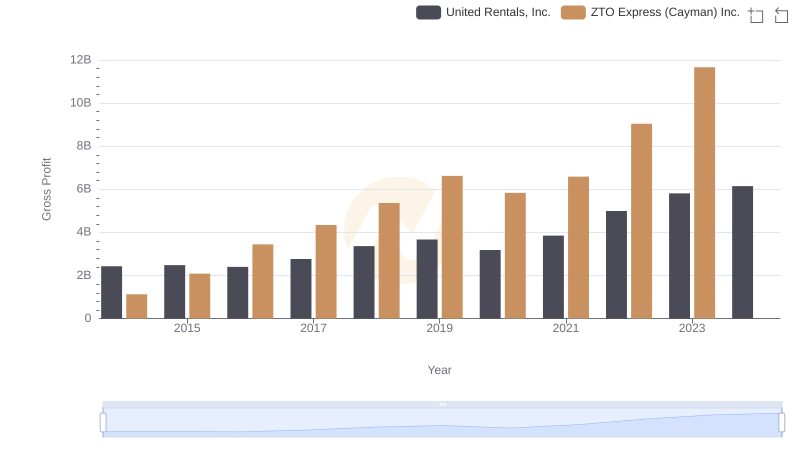
Gross Profit Comparison: United Rentals, Inc. and ZTO Express (Cayman) Inc. Trends
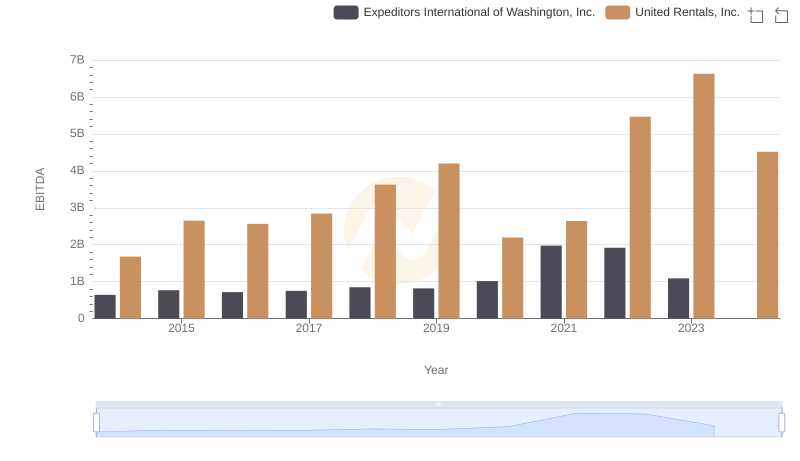
A Side-by-Side Analysis of EBITDA: United Rentals, Inc. and Expeditors International of Washington, Inc.

United Rentals, Inc. vs Owens Corning: In-Depth EBITDA Performance Comparison
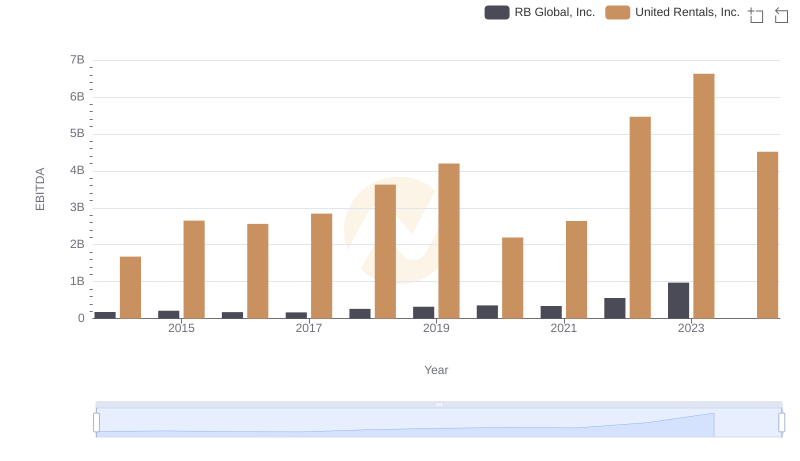
Comprehensive EBITDA Comparison: United Rentals, Inc. vs RB Global, Inc.
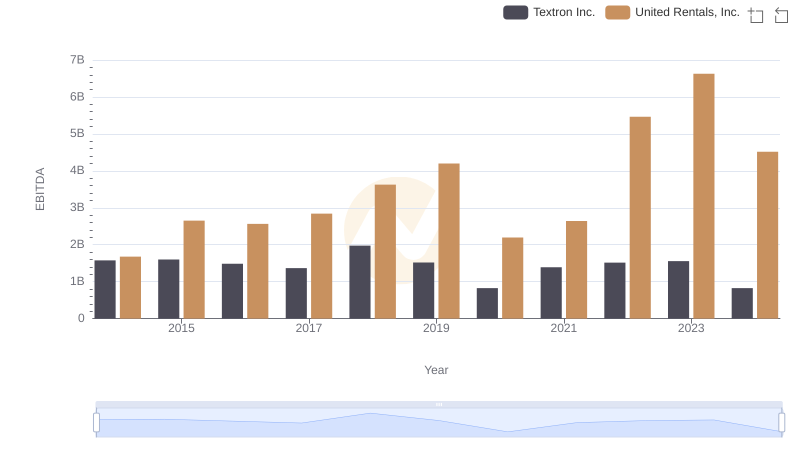
United Rentals, Inc. vs Textron Inc.: In-Depth EBITDA Performance Comparison
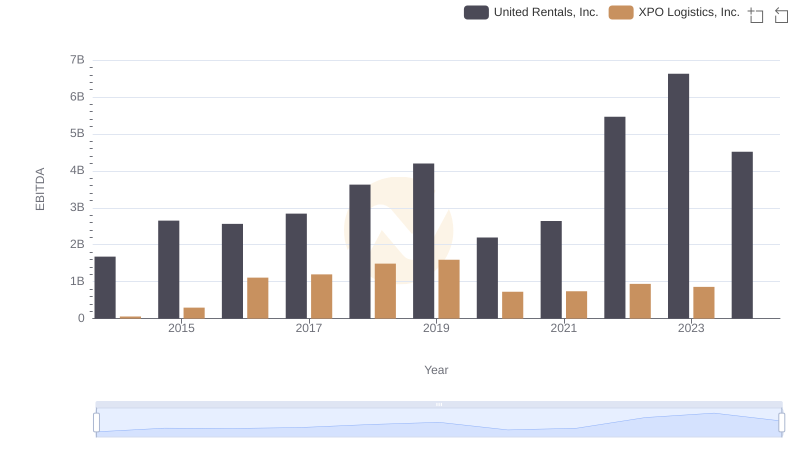
EBITDA Performance Review: United Rentals, Inc. vs XPO Logistics, Inc.
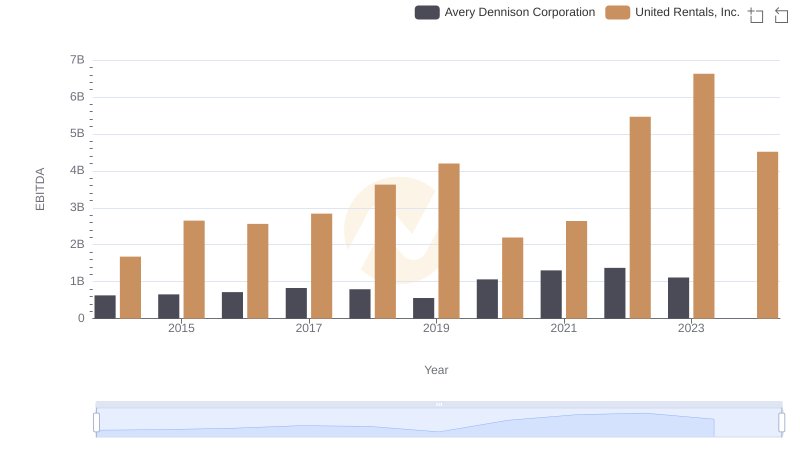
Comparative EBITDA Analysis: United Rentals, Inc. vs Avery Dennison Corporation
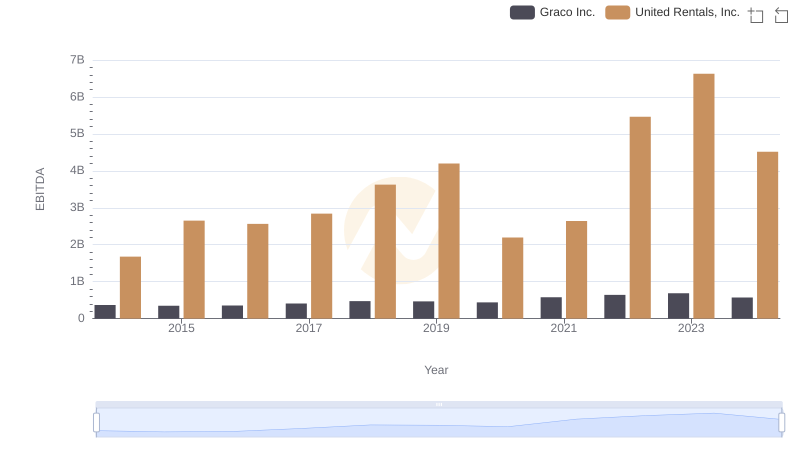
EBITDA Analysis: Evaluating United Rentals, Inc. Against Graco Inc.
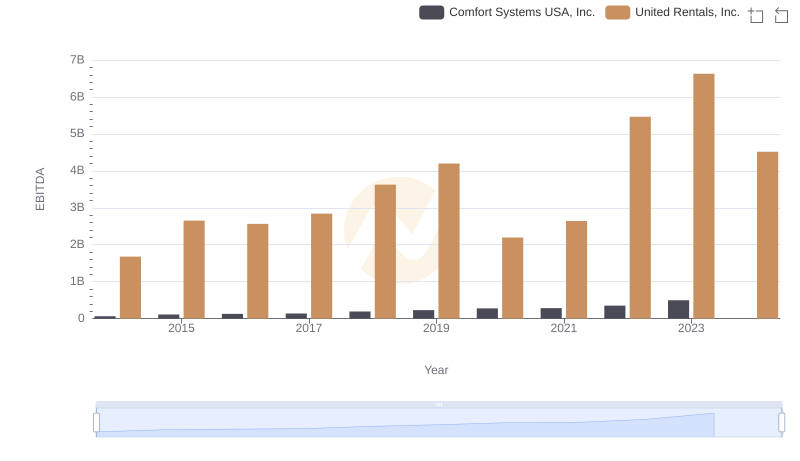
A Side-by-Side Analysis of EBITDA: United Rentals, Inc. and Comfort Systems USA, Inc.