| __timestamp | CDW Corporation | International Business Machines Corporation |
|---|---|---|
| Wednesday, January 1, 2014 | 10153200000 | 46386000000 |
| Thursday, January 1, 2015 | 10872900000 | 41057000000 |
| Friday, January 1, 2016 | 11654700000 | 41403000000 |
| Sunday, January 1, 2017 | 12741600000 | 42196000000 |
| Monday, January 1, 2018 | 13533600000 | 42655000000 |
| Tuesday, January 1, 2019 | 14992500000 | 26181000000 |
| Wednesday, January 1, 2020 | 15257400000 | 24314000000 |
| Friday, January 1, 2021 | 17252300000 | 25865000000 |
| Saturday, January 1, 2022 | 19062100000 | 27842000000 |
| Sunday, January 1, 2023 | 16723599999 | 27560000000 |
| Monday, January 1, 2024 | 16396300000 | 27202000000 |
Infusing magic into the data realm
In the ever-evolving landscape of technology, understanding the cost of revenue is crucial for evaluating a company's financial health. This analysis delves into the cost of revenue trends for International Business Machines Corporation (IBM) and CDW Corporation from 2014 to 2023. Over this period, IBM's cost of revenue has seen a significant decline, dropping from approximately $46 billion in 2014 to around $27 billion in 2023, marking a reduction of nearly 41%. This trend reflects IBM's strategic shift towards more efficient operations and a focus on high-margin services.
Conversely, CDW Corporation has experienced a steady increase in its cost of revenue, growing from about $10 billion in 2014 to nearly $17 billion in 2023, a rise of approximately 70%. This growth aligns with CDW's expansion in the IT services sector. Notably, data for 2024 is missing, indicating potential updates or revisions in future analyses.
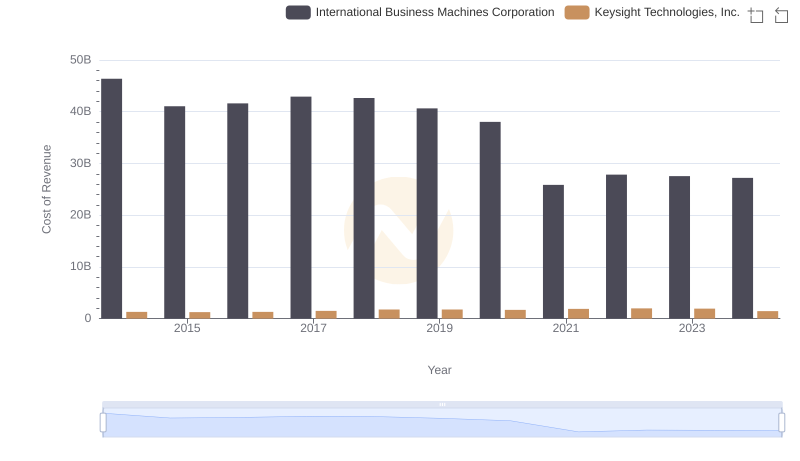
Cost of Revenue Trends: International Business Machines Corporation vs Keysight Technologies, Inc.
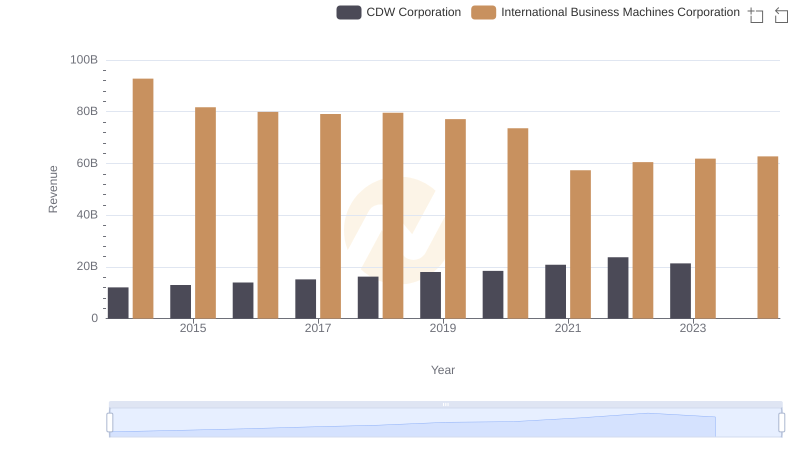
Who Generates More Revenue? International Business Machines Corporation or CDW Corporation
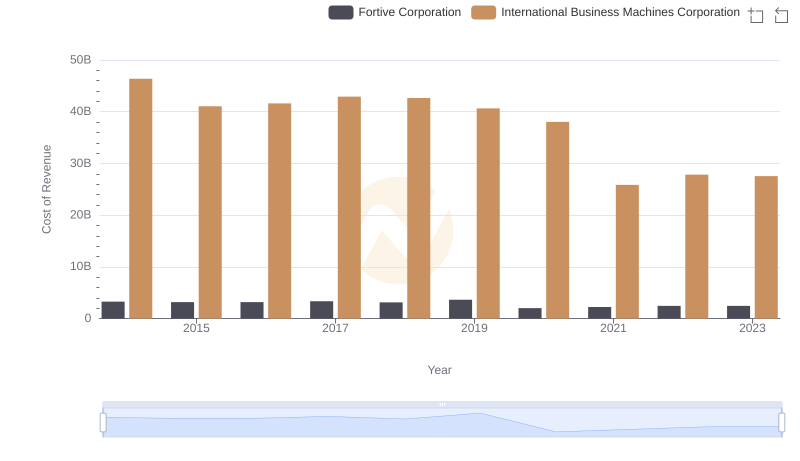
Cost of Revenue Comparison: International Business Machines Corporation vs Fortive Corporation

Analyzing Cost of Revenue: International Business Machines Corporation and Broadridge Financial Solutions, Inc.
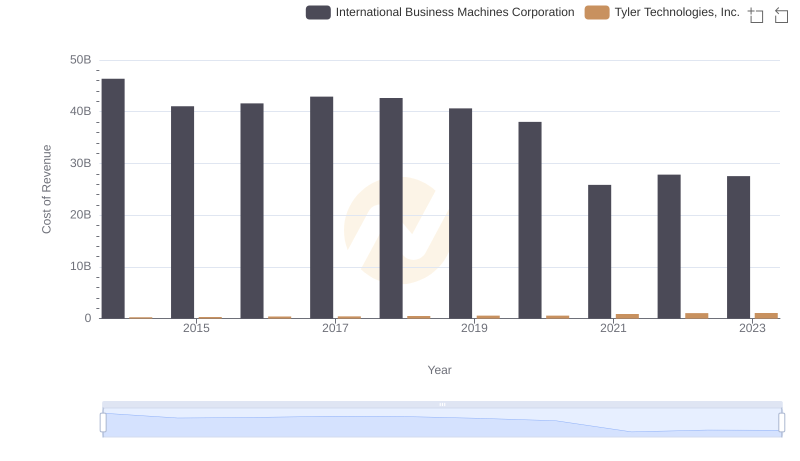
Cost of Revenue: Key Insights for International Business Machines Corporation and Tyler Technologies, Inc.
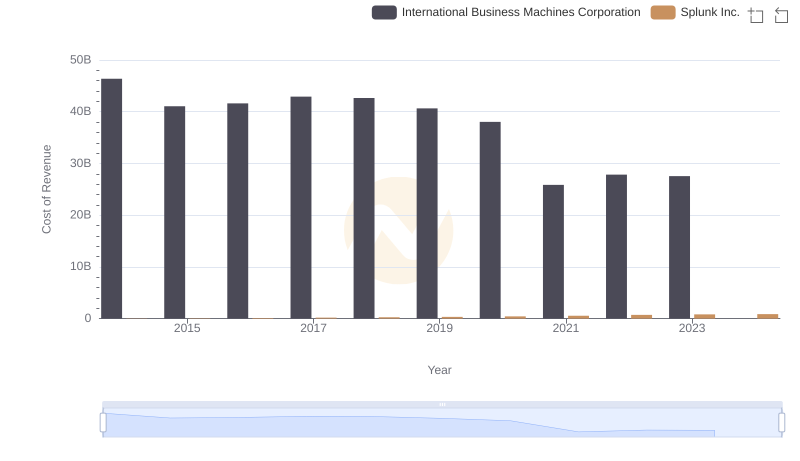
Cost of Revenue Comparison: International Business Machines Corporation vs Splunk Inc.
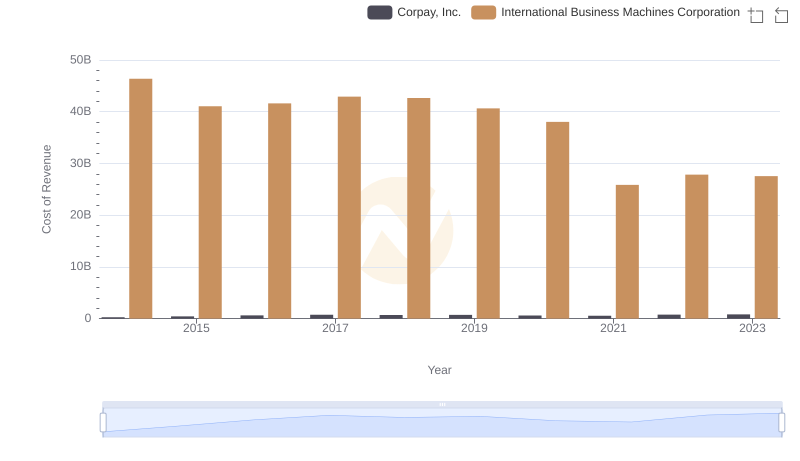
Analyzing Cost of Revenue: International Business Machines Corporation and Corpay, Inc.
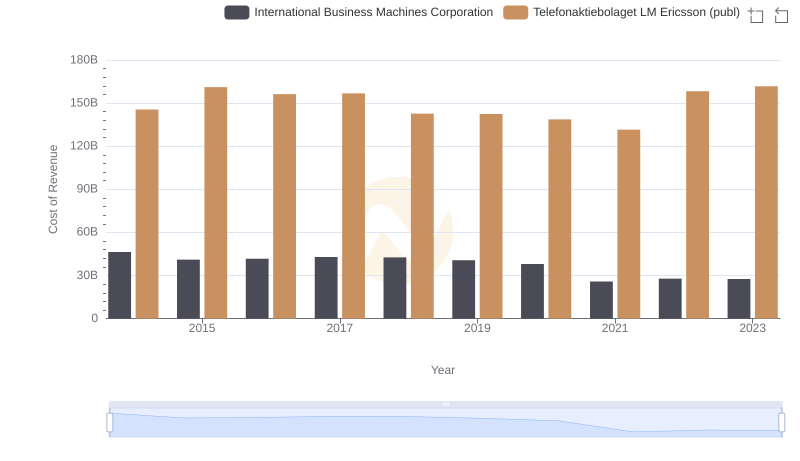
Cost of Revenue Trends: International Business Machines Corporation vs Telefonaktiebolaget LM Ericsson (publ)
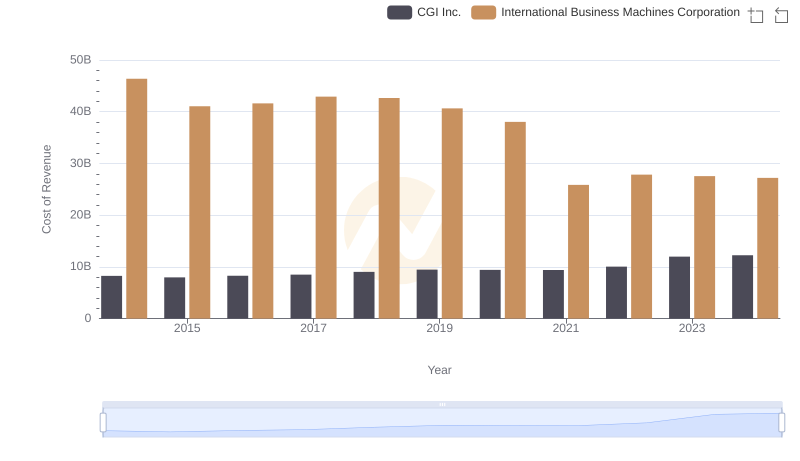
Cost of Revenue Comparison: International Business Machines Corporation vs CGI Inc.
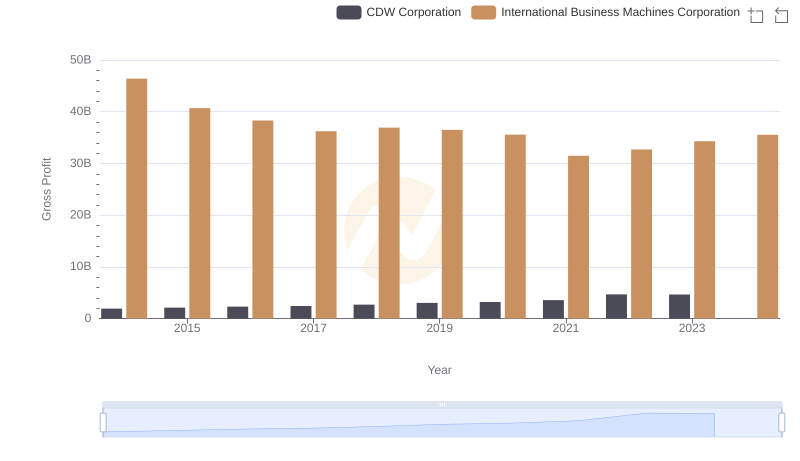
Gross Profit Comparison: International Business Machines Corporation and CDW Corporation Trends
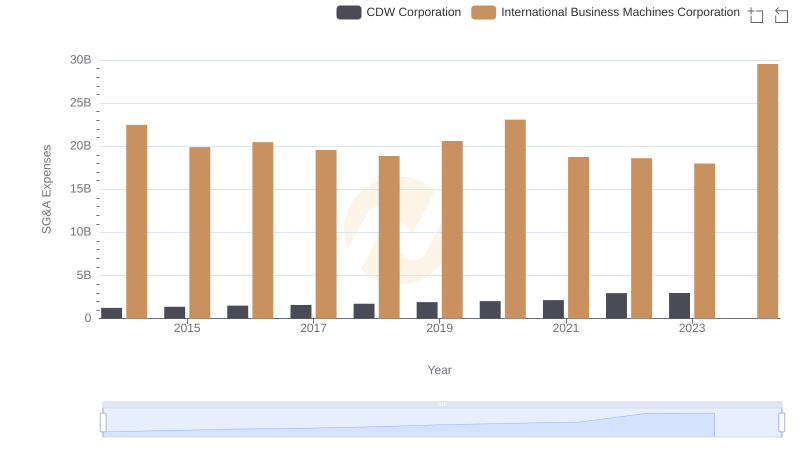
International Business Machines Corporation vs CDW Corporation: SG&A Expense Trends
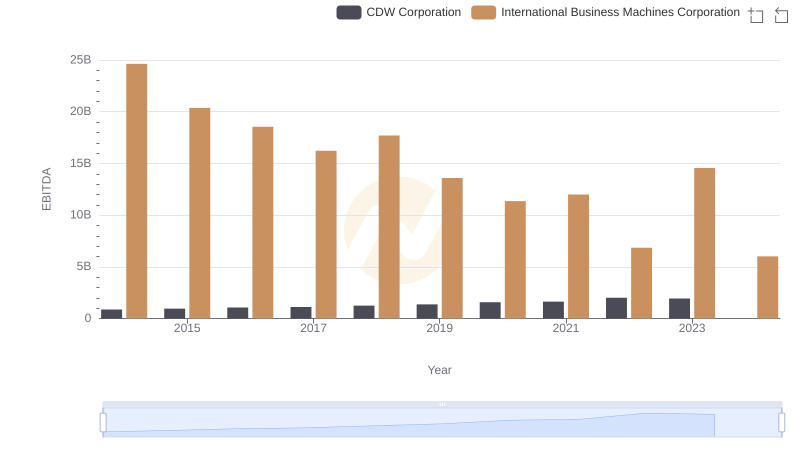
A Side-by-Side Analysis of EBITDA: International Business Machines Corporation and CDW Corporation