| __timestamp | Amphenol Corporation | International Business Machines Corporation |
|---|---|---|
| Wednesday, January 1, 2014 | 3651700000 | 46386000000 |
| Thursday, January 1, 2015 | 3789200000 | 41057000000 |
| Friday, January 1, 2016 | 4246400000 | 41403000000 |
| Sunday, January 1, 2017 | 4701400000 | 42196000000 |
| Monday, January 1, 2018 | 5547100000 | 42655000000 |
| Tuesday, January 1, 2019 | 5609400000 | 26181000000 |
| Wednesday, January 1, 2020 | 5934800000 | 24314000000 |
| Friday, January 1, 2021 | 7474500000 | 25865000000 |
| Saturday, January 1, 2022 | 8594800000 | 27842000000 |
| Sunday, January 1, 2023 | 8470600000 | 27560000000 |
| Monday, January 1, 2024 | 10083000000 | 27202000000 |
Unveiling the hidden dimensions of data
In the ever-evolving landscape of technology and electronics, cost efficiency remains a pivotal factor for success. Over the past decade, International Business Machines Corporation (IBM) and Amphenol Corporation have showcased contrasting trajectories in their cost of revenue. From 2014 to 2024, IBM's cost of revenue has seen a significant decline, dropping from approximately 46 billion to 27 billion, a reduction of nearly 41%. This trend reflects IBM's strategic shift towards more efficient operations and cost management.
Conversely, Amphenol Corporation has experienced a steady increase in its cost of revenue, rising from around 3.7 billion to 10 billion, marking a growth of over 170%. This surge underscores Amphenol's expansion and investment in its production capabilities. As these two industry leaders navigate their financial landscapes, their contrasting approaches offer valuable insights into the dynamics of cost efficiency in the tech sector.
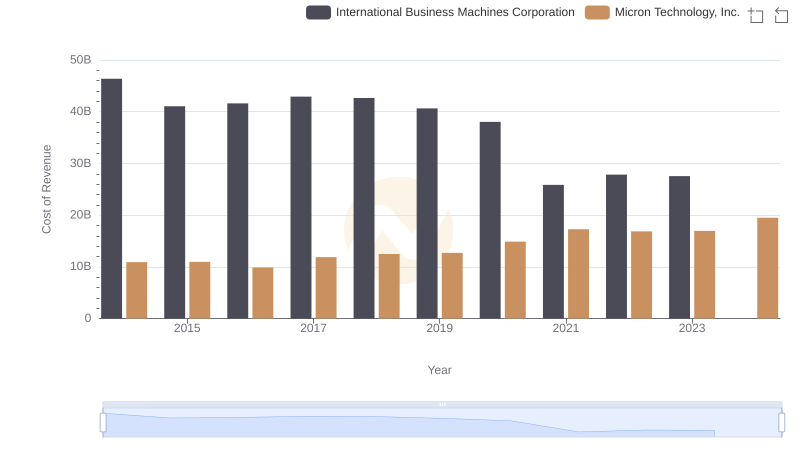
Cost of Revenue: Key Insights for International Business Machines Corporation and Micron Technology, Inc.
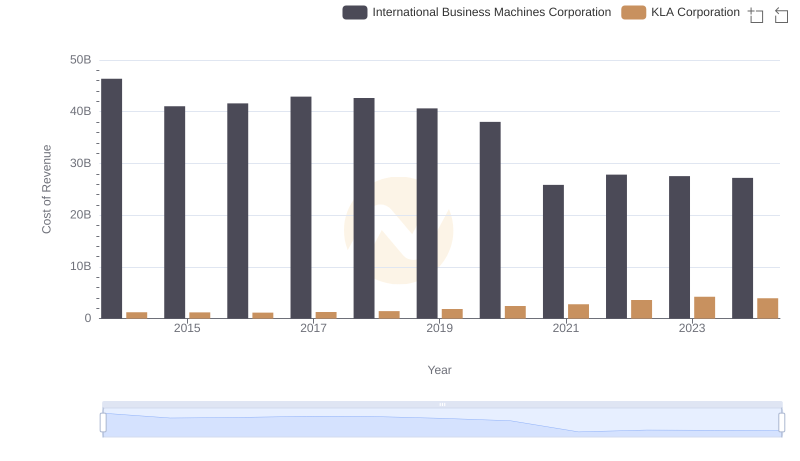
Cost Insights: Breaking Down International Business Machines Corporation and KLA Corporation's Expenses
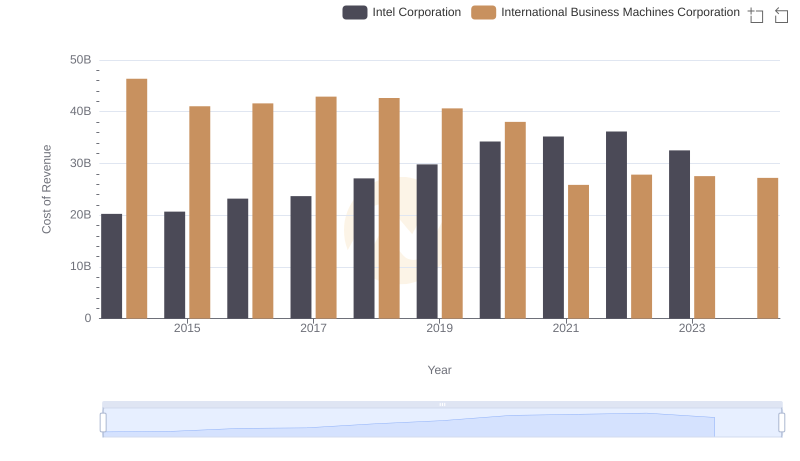
Cost Insights: Breaking Down International Business Machines Corporation and Intel Corporation's Expenses
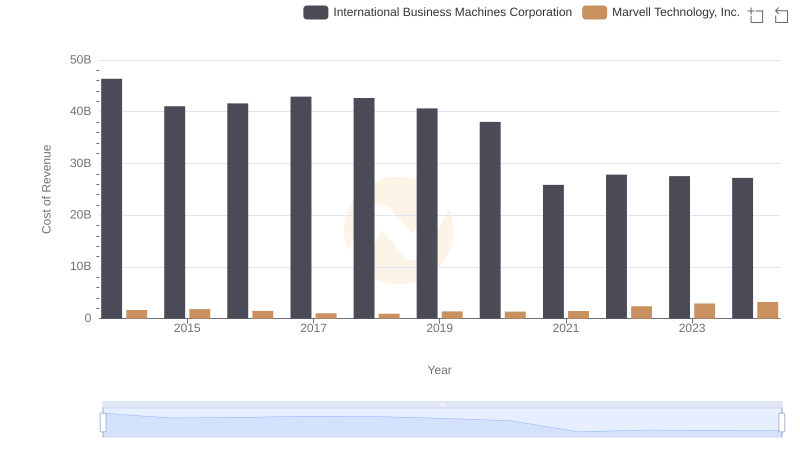
Cost Insights: Breaking Down International Business Machines Corporation and Marvell Technology, Inc.'s Expenses
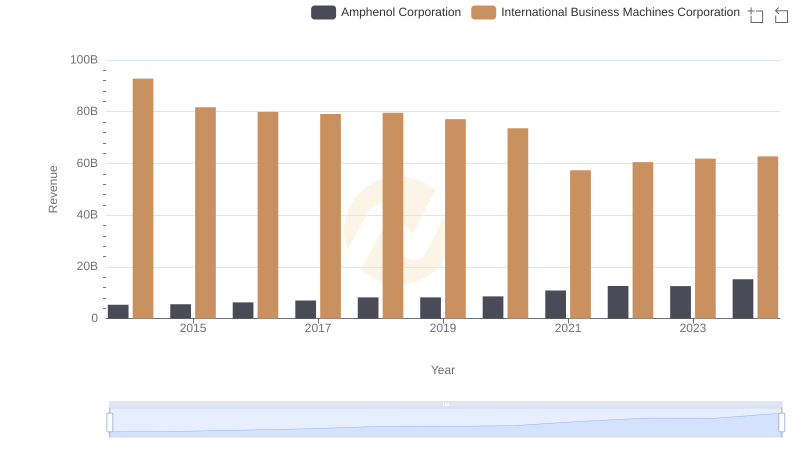
Revenue Insights: International Business Machines Corporation and Amphenol Corporation Performance Compared
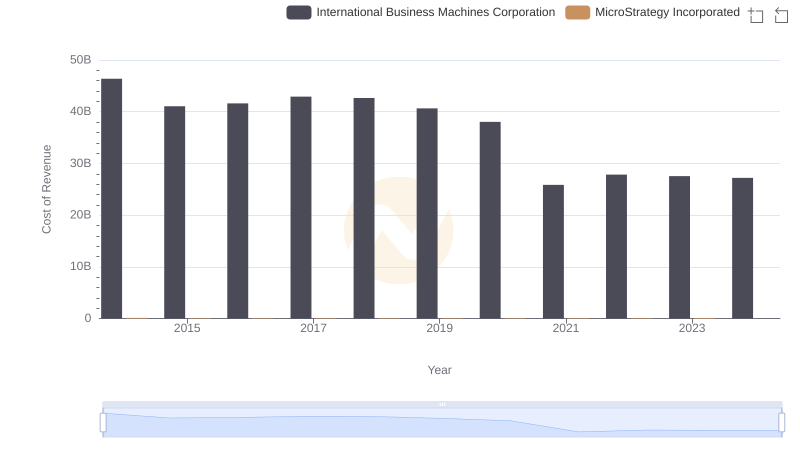
Cost of Revenue: Key Insights for International Business Machines Corporation and MicroStrategy Incorporated
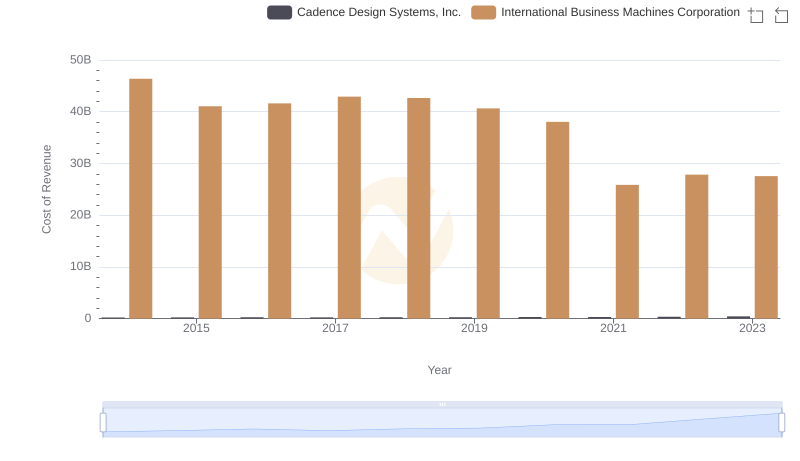
Cost of Revenue Comparison: International Business Machines Corporation vs Cadence Design Systems, Inc.

Cost of Revenue Comparison: International Business Machines Corporation vs Synopsys, Inc.
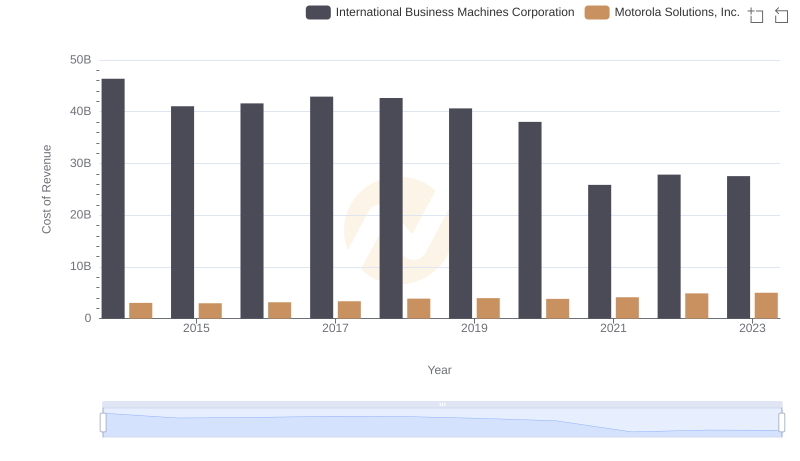
Analyzing Cost of Revenue: International Business Machines Corporation and Motorola Solutions, Inc.
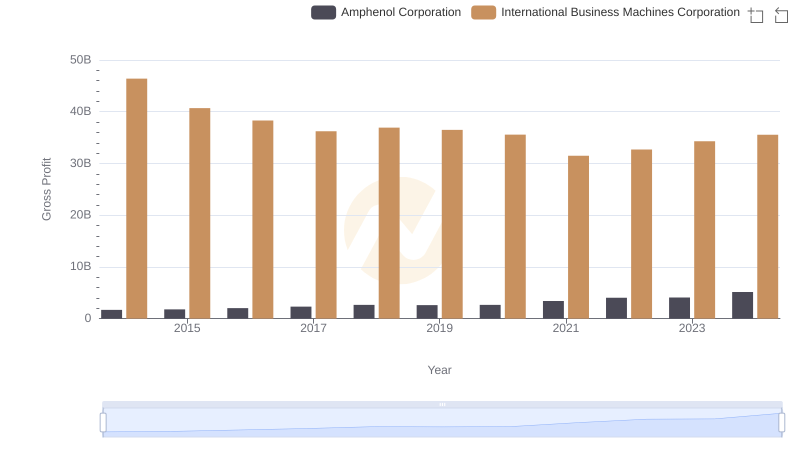
Who Generates Higher Gross Profit? International Business Machines Corporation or Amphenol Corporation
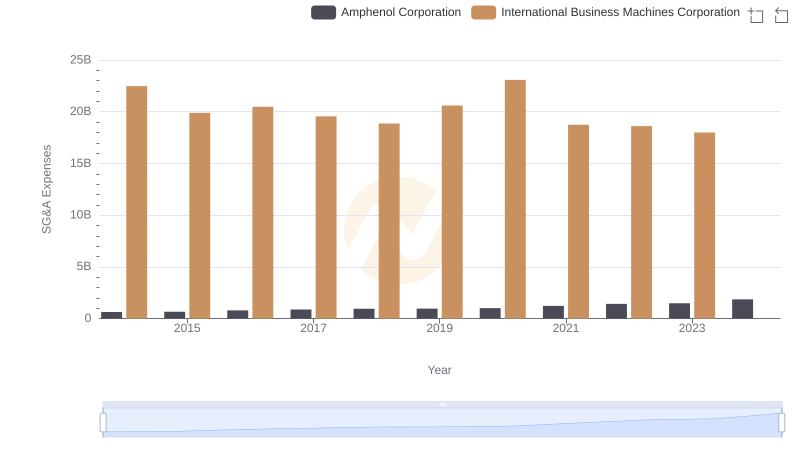
International Business Machines Corporation or Amphenol Corporation: Who Manages SG&A Costs Better?
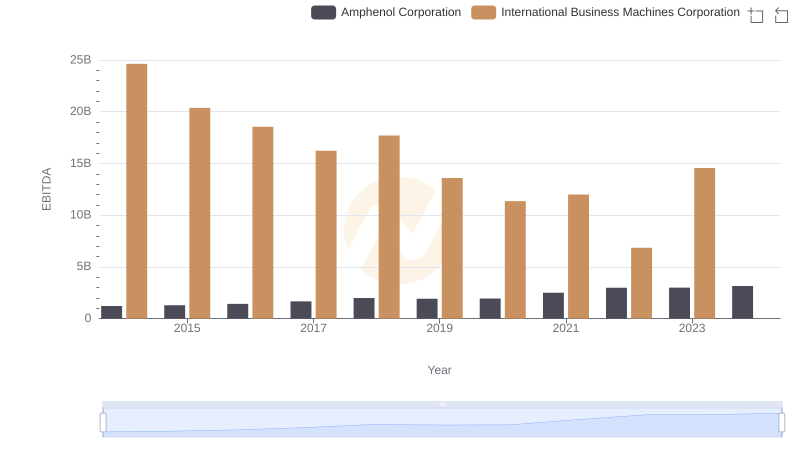
A Side-by-Side Analysis of EBITDA: International Business Machines Corporation and Amphenol Corporation