| __timestamp | EMCOR Group, Inc. | ITT Inc. |
|---|---|---|
| Wednesday, January 1, 2014 | 907246000 | 866400000 |
| Thursday, January 1, 2015 | 944479000 | 809100000 |
| Friday, January 1, 2016 | 1037862000 | 758200000 |
| Sunday, January 1, 2017 | 1147012000 | 817200000 |
| Monday, January 1, 2018 | 1205453000 | 887200000 |
| Tuesday, January 1, 2019 | 1355868000 | 910100000 |
| Wednesday, January 1, 2020 | 1395382000 | 782200000 |
| Friday, January 1, 2021 | 1501737000 | 899500000 |
| Saturday, January 1, 2022 | 1603594000 | 922300000 |
| Sunday, January 1, 2023 | 2089339000 | 1107300000 |
| Monday, January 1, 2024 | 1247300000 |
Data in motion
In the competitive landscape of industrial services and manufacturing, EMCOR Group, Inc. and ITT Inc. have been pivotal players. Over the past decade, EMCOR has consistently outperformed ITT in terms of gross profit. From 2014 to 2023, EMCOR's gross profit surged by approximately 130%, peaking in 2023 with a remarkable 2.1 billion dollars. In contrast, ITT's growth was more modest, with a 28% increase over the same period, reaching just over 1.1 billion dollars in 2023.
This trend highlights EMCOR's robust growth strategy and market adaptability, positioning it as a leader in the industry. Meanwhile, ITT's steady performance underscores its resilience and commitment to innovation. As these companies continue to evolve, their financial trajectories offer valuable insights into the dynamics of the industrial sector.
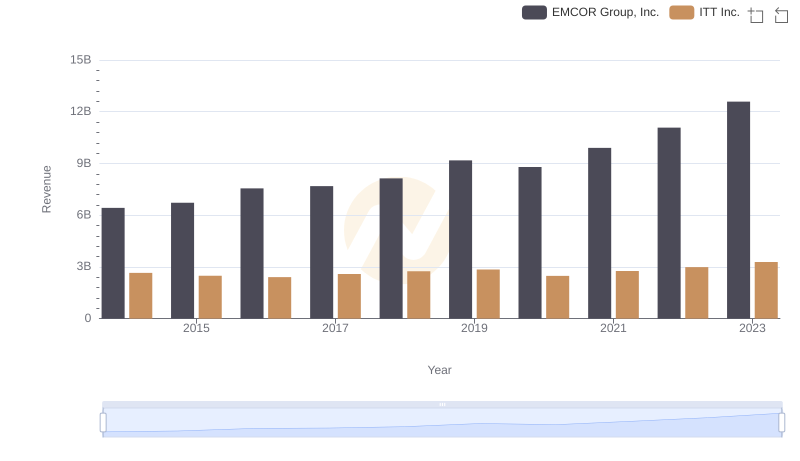
EMCOR Group, Inc. vs ITT Inc.: Annual Revenue Growth Compared
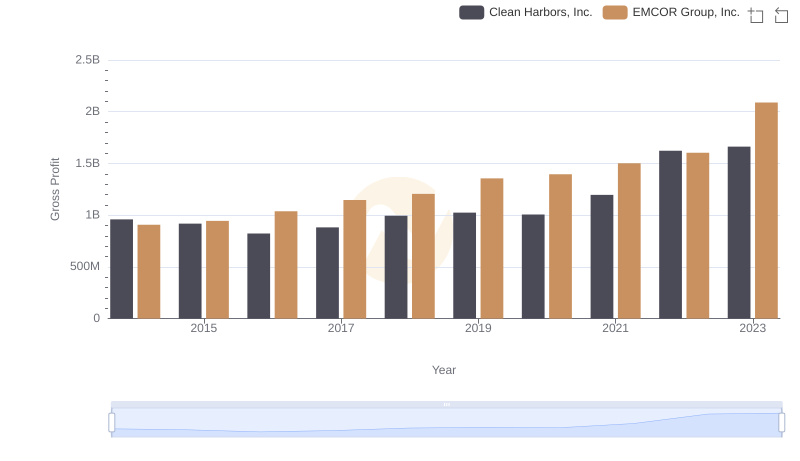
EMCOR Group, Inc. and Clean Harbors, Inc.: A Detailed Gross Profit Analysis
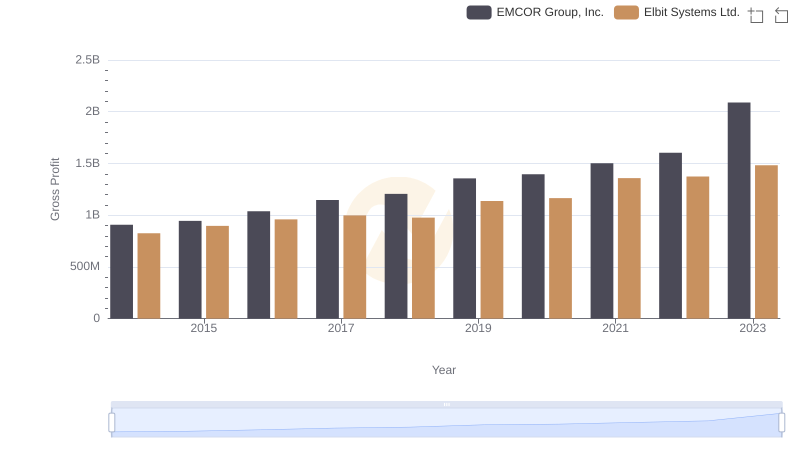
EMCOR Group, Inc. vs Elbit Systems Ltd.: A Gross Profit Performance Breakdown
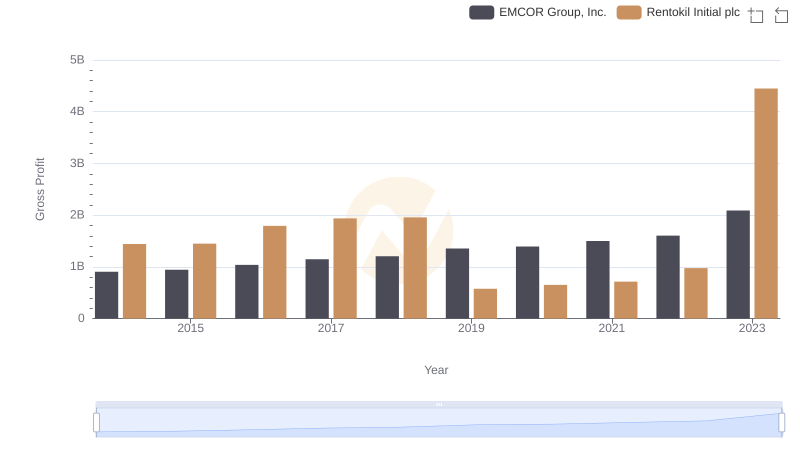
Who Generates Higher Gross Profit? EMCOR Group, Inc. or Rentokil Initial plc
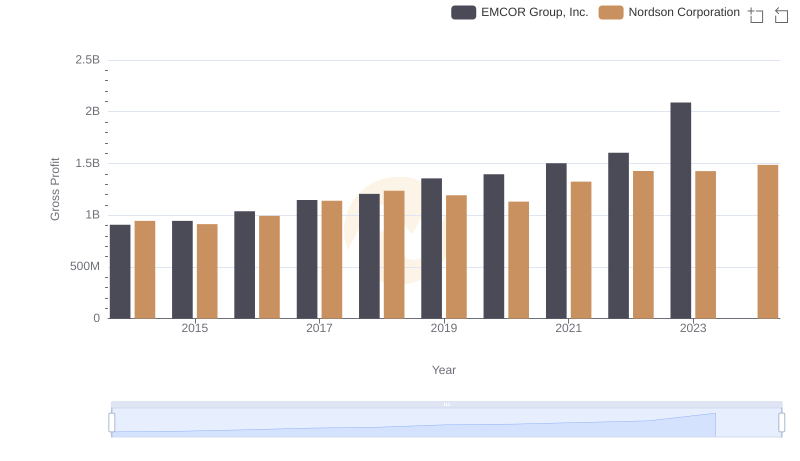
Key Insights on Gross Profit: EMCOR Group, Inc. vs Nordson Corporation
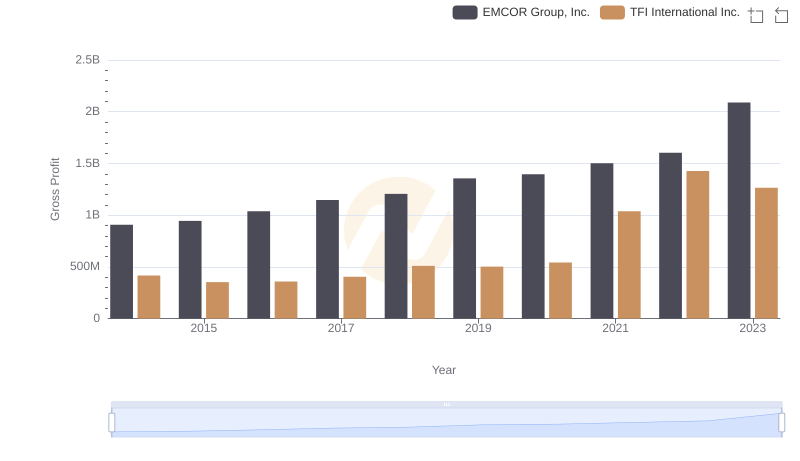
Gross Profit Analysis: Comparing EMCOR Group, Inc. and TFI International Inc.
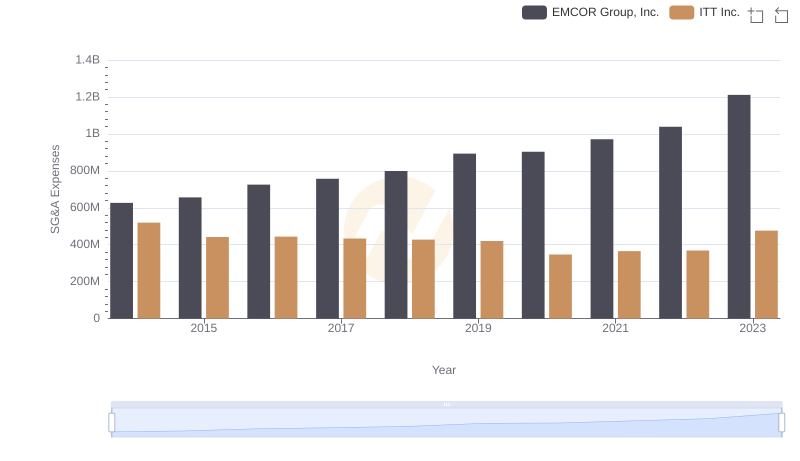
EMCOR Group, Inc. vs ITT Inc.: SG&A Expense Trends
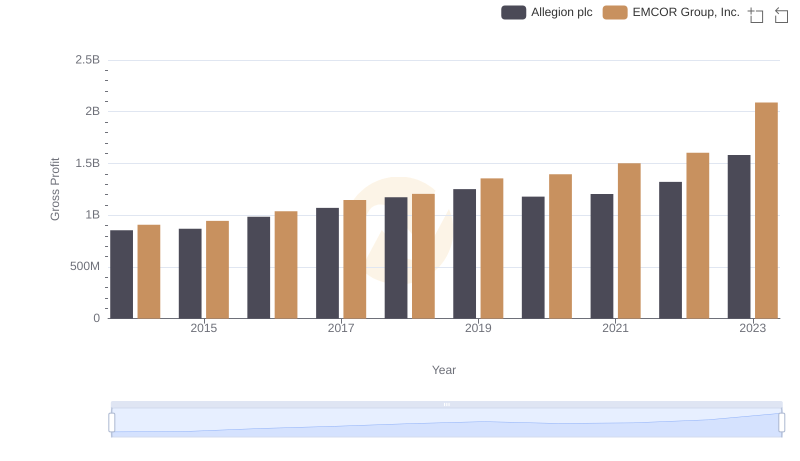
Gross Profit Trends Compared: EMCOR Group, Inc. vs Allegion plc
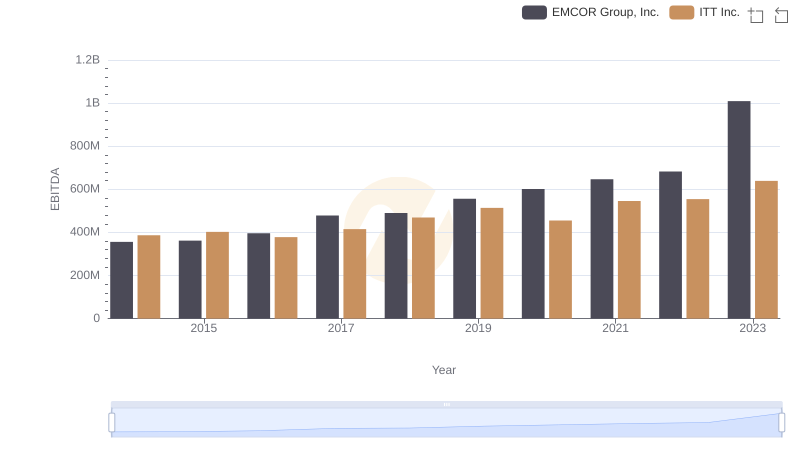
A Side-by-Side Analysis of EBITDA: EMCOR Group, Inc. and ITT Inc.