| __timestamp | EMCOR Group, Inc. | ITT Inc. |
|---|---|---|
| Wednesday, January 1, 2014 | 626478000 | 519500000 |
| Thursday, January 1, 2015 | 656573000 | 441500000 |
| Friday, January 1, 2016 | 725538000 | 444100000 |
| Sunday, January 1, 2017 | 757062000 | 433700000 |
| Monday, January 1, 2018 | 799157000 | 427300000 |
| Tuesday, January 1, 2019 | 893453000 | 420000000 |
| Wednesday, January 1, 2020 | 903584000 | 347200000 |
| Friday, January 1, 2021 | 970937000 | 365100000 |
| Saturday, January 1, 2022 | 1038717000 | 368500000 |
| Sunday, January 1, 2023 | 1211233000 | 476600000 |
| Monday, January 1, 2024 | 502300000 |
Unveiling the hidden dimensions of data
In the competitive landscape of industrial services and manufacturing, understanding the financial health of companies is crucial. Over the past decade, EMCOR Group, Inc. and ITT Inc. have shown distinct trends in their Selling, General, and Administrative (SG&A) expenses. From 2014 to 2023, EMCOR's SG&A expenses surged by approximately 93%, reflecting its aggressive expansion and operational scaling. In contrast, ITT Inc. experienced a more modest fluctuation, with a 9% decrease in SG&A expenses, indicating a focus on efficiency and cost management.
These trends offer a window into each company's strategic priorities and market positioning over the years.
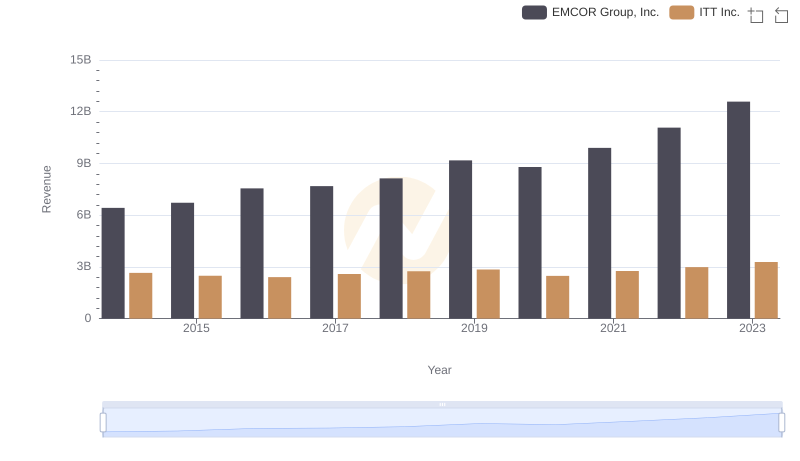
EMCOR Group, Inc. vs ITT Inc.: Annual Revenue Growth Compared
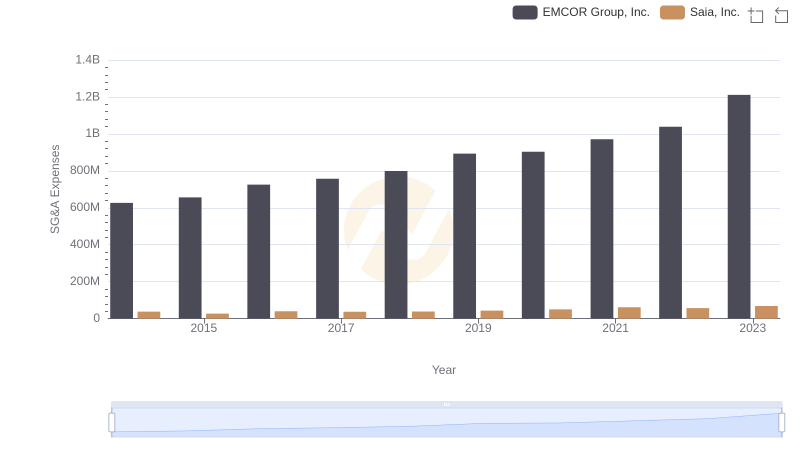
SG&A Efficiency Analysis: Comparing EMCOR Group, Inc. and Saia, Inc.
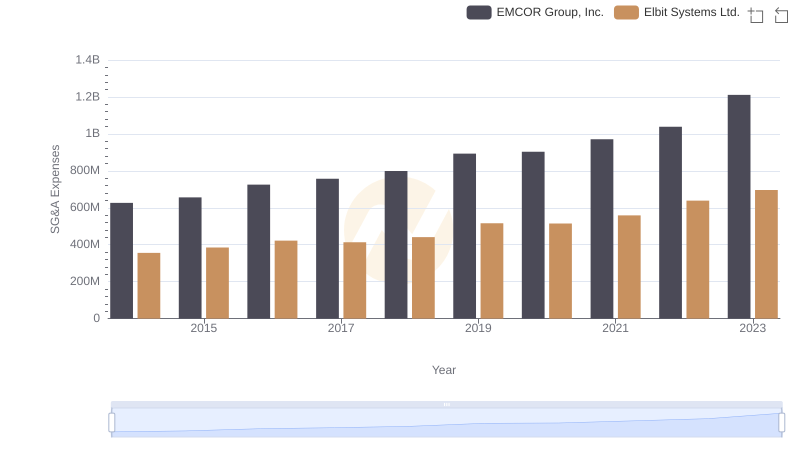
Breaking Down SG&A Expenses: EMCOR Group, Inc. vs Elbit Systems Ltd.
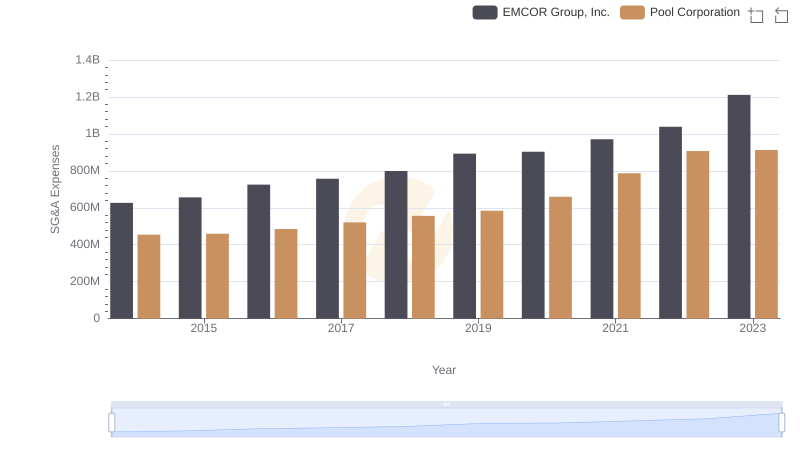
EMCOR Group, Inc. vs Pool Corporation: SG&A Expense Trends
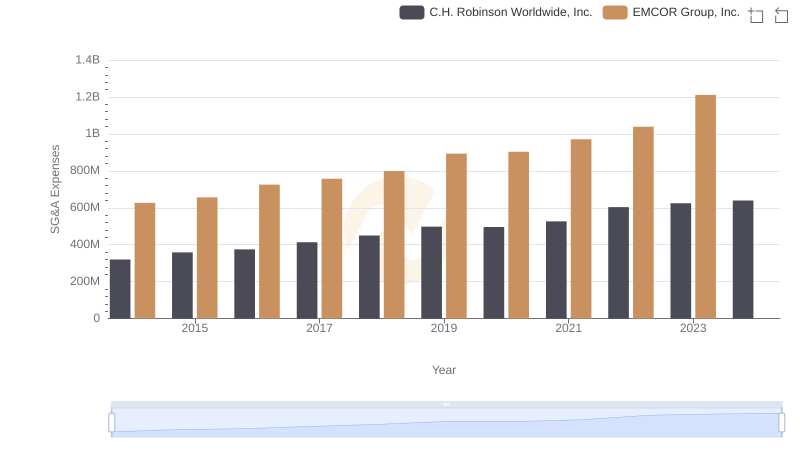
EMCOR Group, Inc. or C.H. Robinson Worldwide, Inc.: Who Manages SG&A Costs Better?
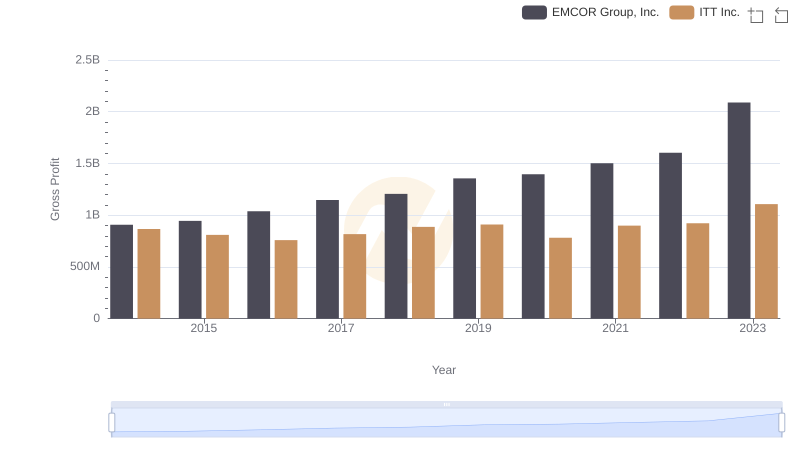
Who Generates Higher Gross Profit? EMCOR Group, Inc. or ITT Inc.
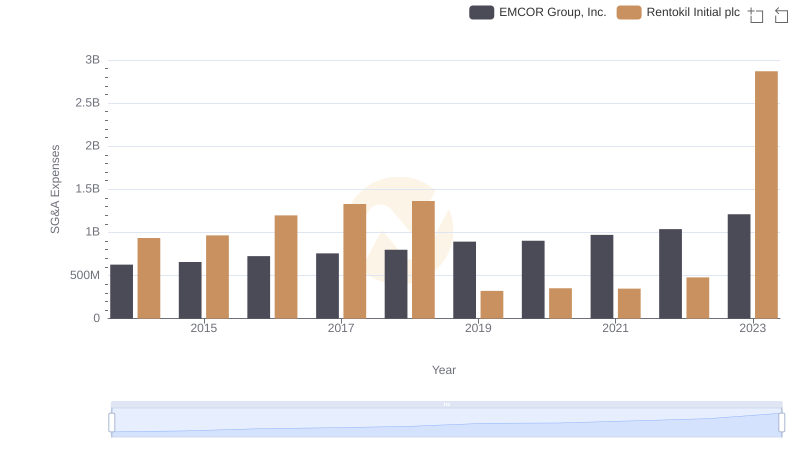
EMCOR Group, Inc. and Rentokil Initial plc: SG&A Spending Patterns Compared

EMCOR Group, Inc. and Allegion plc: SG&A Spending Patterns Compared
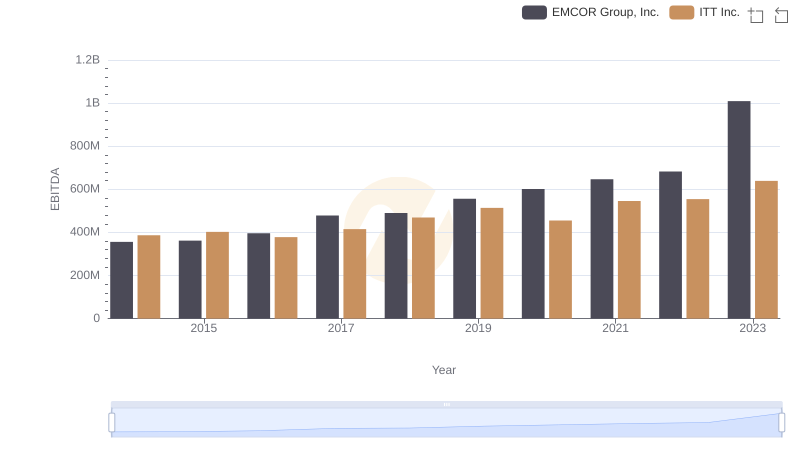
A Side-by-Side Analysis of EBITDA: EMCOR Group, Inc. and ITT Inc.