| __timestamp | Lennox International Inc. | XPO Logistics, Inc. |
|---|---|---|
| Wednesday, January 1, 2014 | 3367400000 | 2356600000 |
| Thursday, January 1, 2015 | 3467400000 | 7623200000 |
| Friday, January 1, 2016 | 3641600000 | 14619400000 |
| Sunday, January 1, 2017 | 3839600000 | 15380800000 |
| Monday, January 1, 2018 | 3883900000 | 17279000000 |
| Tuesday, January 1, 2019 | 3807200000 | 16648000000 |
| Wednesday, January 1, 2020 | 3634100000 | 16252000000 |
| Friday, January 1, 2021 | 4194100000 | 12806000000 |
| Saturday, January 1, 2022 | 4718400000 | 7718000000 |
| Sunday, January 1, 2023 | 4981900000 | 7744000000 |
| Monday, January 1, 2024 | 5341300000 | 8072000000 |
Unleashing insights
In the ever-evolving landscape of the logistics and manufacturing sectors, Lennox International Inc. and XPO Logistics, Inc. have been formidable players. Over the past decade, Lennox International has seen a steady revenue growth, starting from approximately $3.4 billion in 2014 to an impressive $5.3 billion in 2024, marking a growth of over 57%. Meanwhile, XPO Logistics experienced a meteoric rise, with revenues peaking at around $17.3 billion in 2018, a staggering 633% increase from 2014. However, recent years have shown a decline, with revenues dropping to about $7.7 billion by 2023. This data highlights the dynamic nature of these industries, where strategic decisions and market conditions can lead to significant shifts. As we look to the future, the question remains: will Lennox continue its upward trajectory, and can XPO regain its former glory?
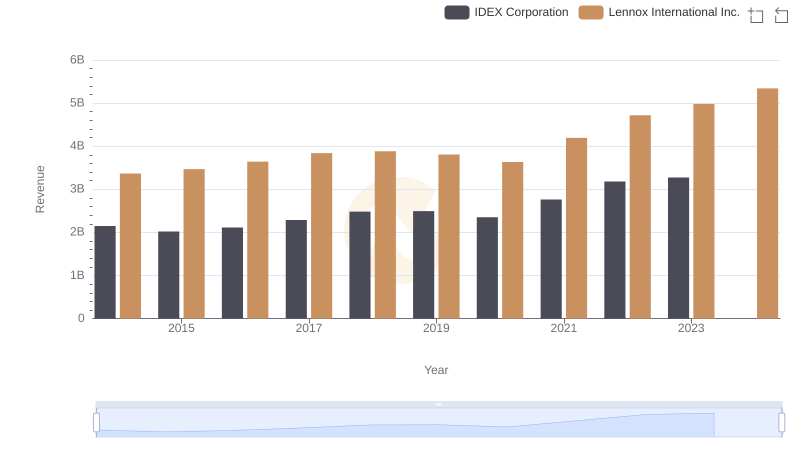
Who Generates More Revenue? Lennox International Inc. or IDEX Corporation
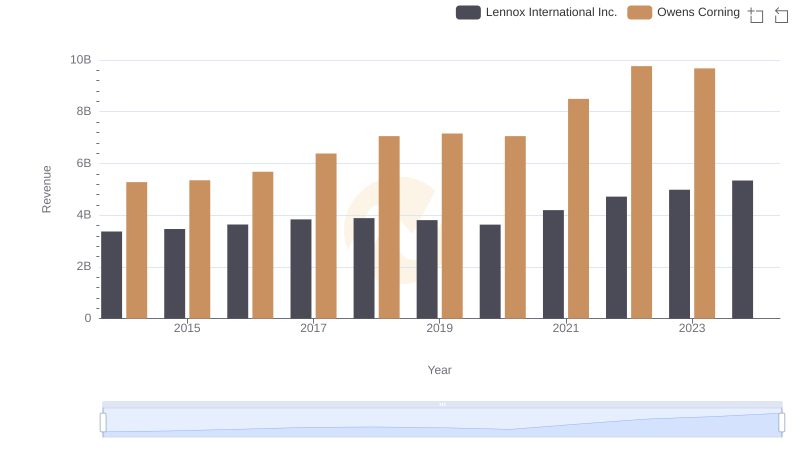
Lennox International Inc. and Owens Corning: A Comprehensive Revenue Analysis
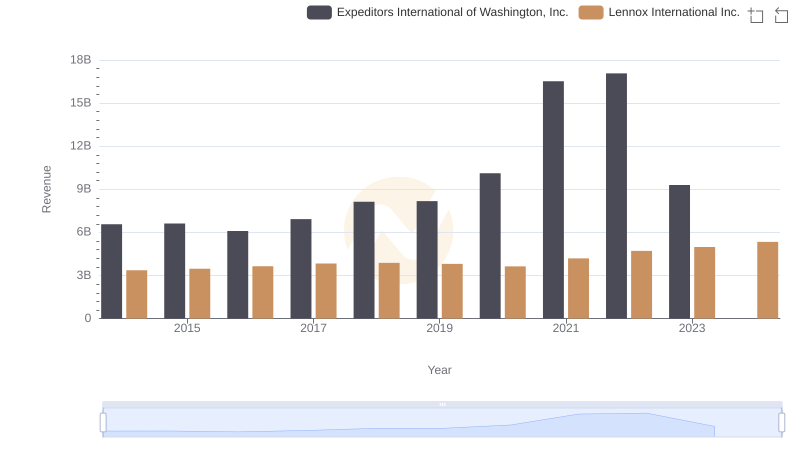
Lennox International Inc. vs Expeditors International of Washington, Inc.: Examining Key Revenue Metrics
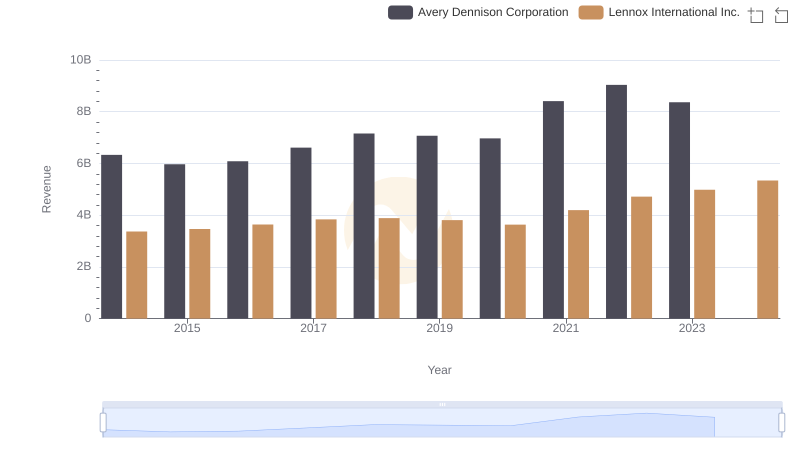
Lennox International Inc. and Avery Dennison Corporation: A Comprehensive Revenue Analysis
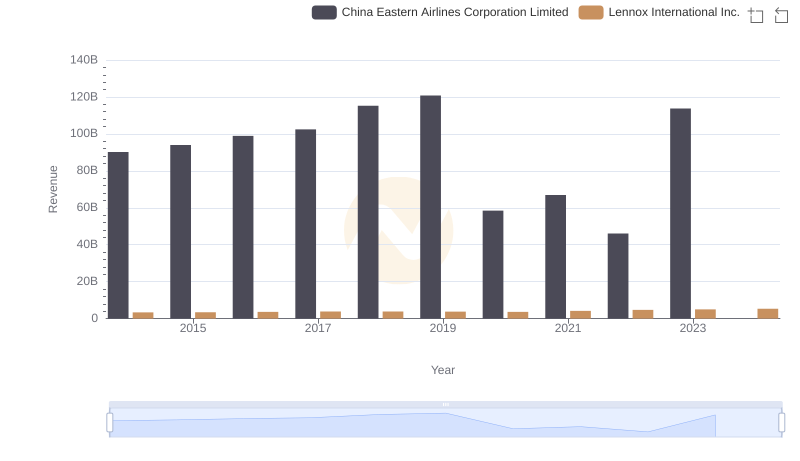
Revenue Insights: Lennox International Inc. and China Eastern Airlines Corporation Limited Performance Compared
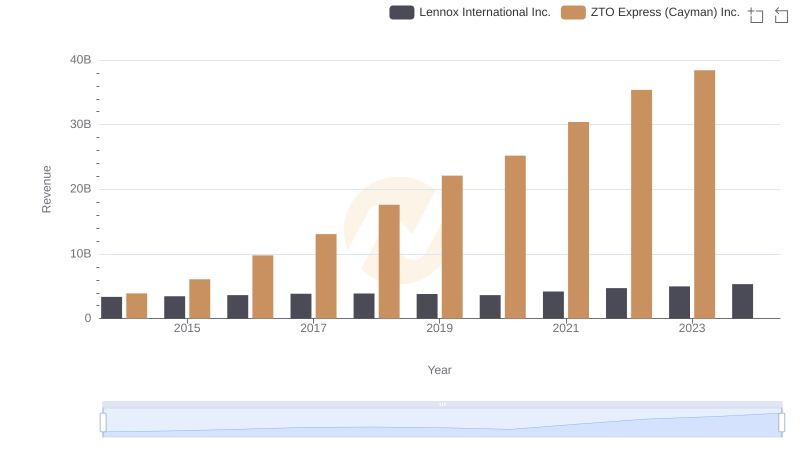
Lennox International Inc. and ZTO Express (Cayman) Inc.: A Comprehensive Revenue Analysis
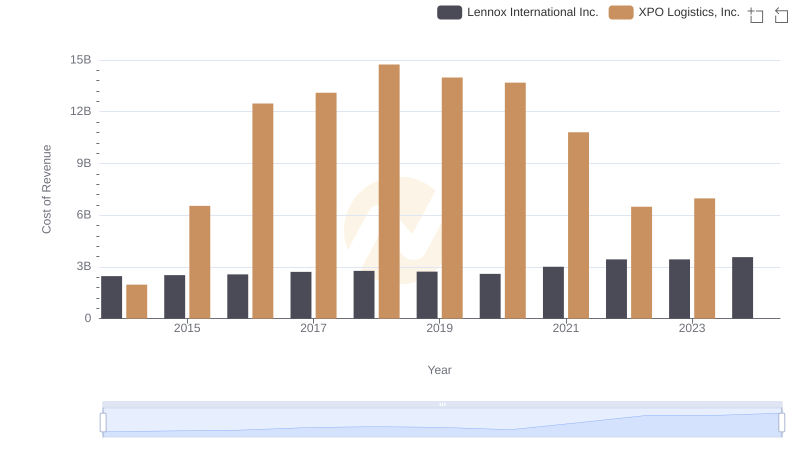
Lennox International Inc. vs XPO Logistics, Inc.: Efficiency in Cost of Revenue Explored
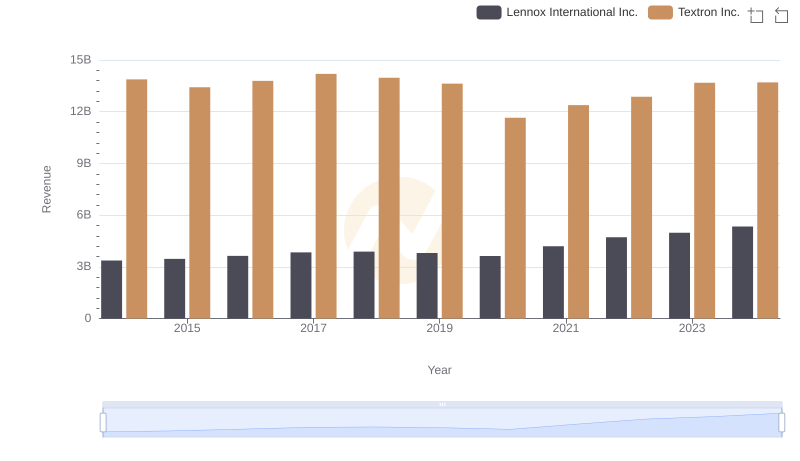
Lennox International Inc. vs Textron Inc.: Annual Revenue Growth Compared
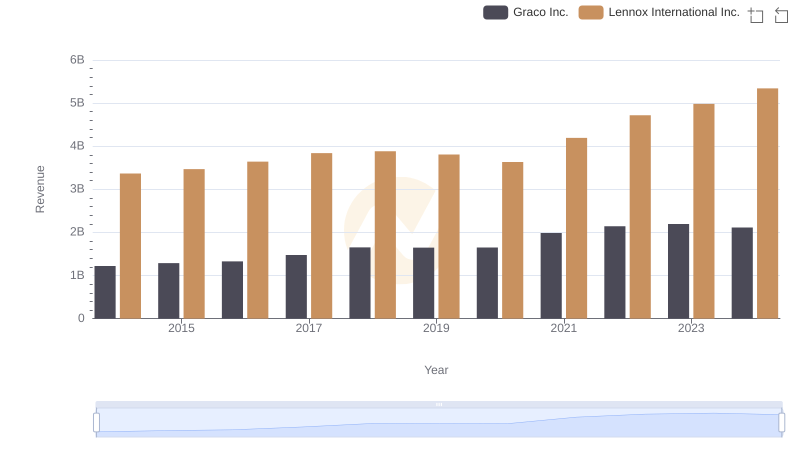
Revenue Showdown: Lennox International Inc. vs Graco Inc.
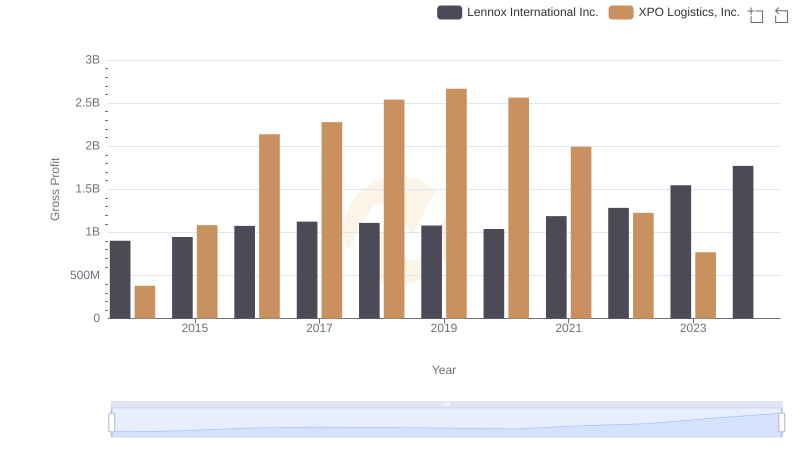
Gross Profit Comparison: Lennox International Inc. and XPO Logistics, Inc. Trends
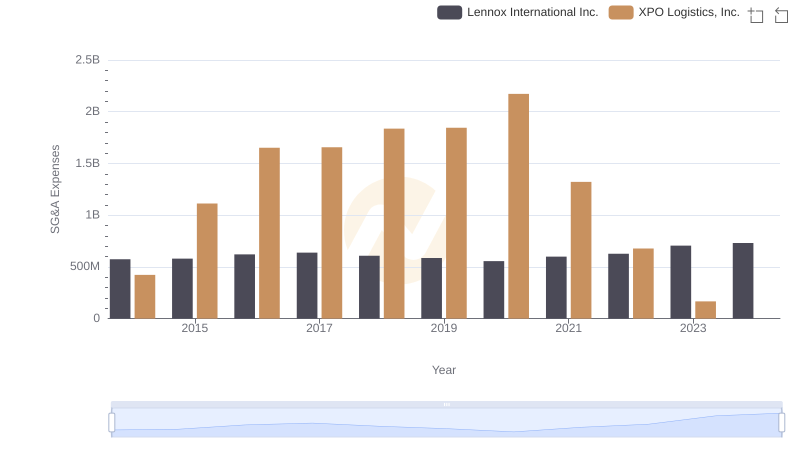
Lennox International Inc. vs XPO Logistics, Inc.: SG&A Expense Trends
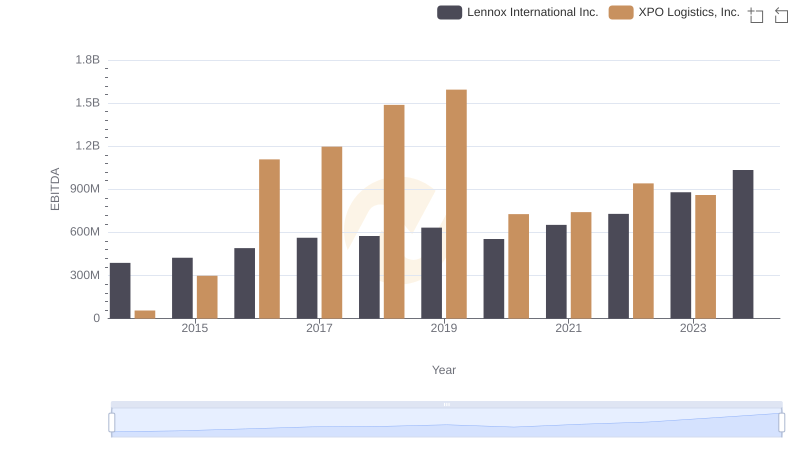
A Professional Review of EBITDA: Lennox International Inc. Compared to XPO Logistics, Inc.