| __timestamp | Trane Technologies plc | W.W. Grainger, Inc. |
|---|---|---|
| Wednesday, January 1, 2014 | 2503900000 | 2967125000 |
| Thursday, January 1, 2015 | 2541100000 | 2931108000 |
| Friday, January 1, 2016 | 2606500000 | 2995060000 |
| Sunday, January 1, 2017 | 2720700000 | 3048895000 |
| Monday, January 1, 2018 | 2903200000 | 3190000000 |
| Tuesday, January 1, 2019 | 3129800000 | 3135000000 |
| Wednesday, January 1, 2020 | 2270600000 | 3219000000 |
| Friday, January 1, 2021 | 2446300000 | 3173000000 |
| Saturday, January 1, 2022 | 2545900000 | 3634000000 |
| Sunday, January 1, 2023 | 2963200000 | 3931000000 |
| Monday, January 1, 2024 | 3580400000 | 4121000000 |
Unleashing insights
In the competitive landscape of industrial and commercial sectors, managing Selling, General, and Administrative (SG&A) expenses is crucial for profitability. Trane Technologies plc and W.W. Grainger, Inc. have been at the forefront of this financial balancing act since 2014. Over the past decade, Trane Technologies has demonstrated a more consistent approach, maintaining an average SG&A expense of approximately 2.66 billion USD annually. In contrast, W.W. Grainger's expenses have averaged around 3.22 billion USD, reflecting a 21% higher cost management challenge.
From 2014 to 2023, Trane Technologies showed a notable dip in 2020, reducing expenses by 27% compared to the previous year, a strategic move during global economic uncertainties. Meanwhile, W.W. Grainger's expenses peaked in 2023, marking a 32% increase from 2014. This data highlights the contrasting strategies and adaptability of these industry leaders in optimizing their SG&A costs.
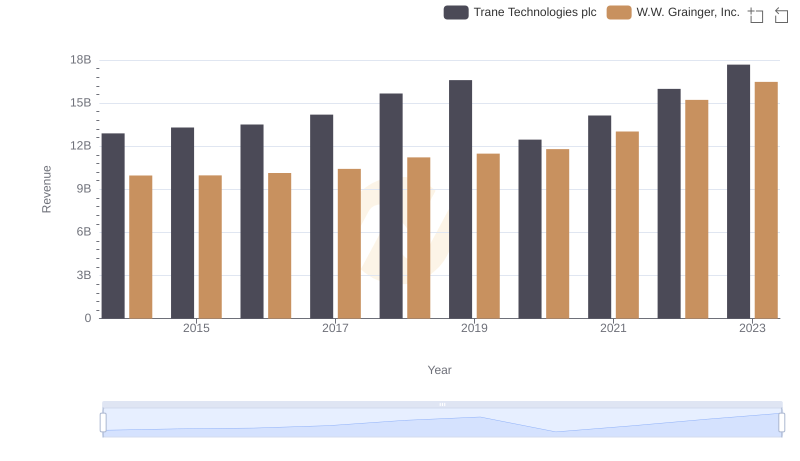
Annual Revenue Comparison: Trane Technologies plc vs W.W. Grainger, Inc.
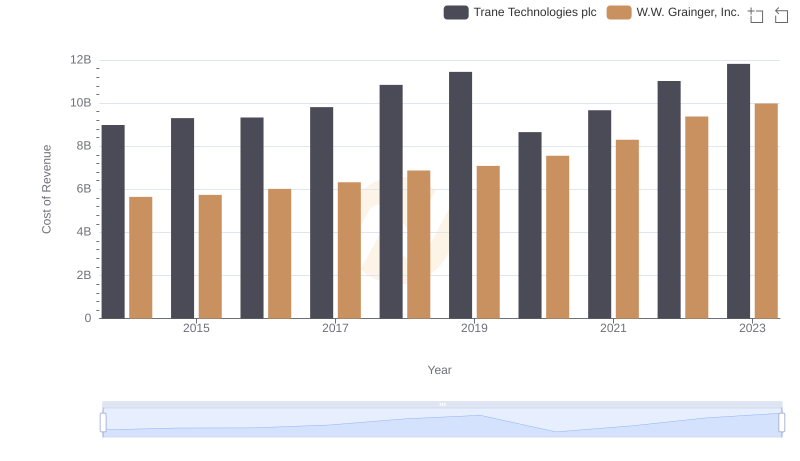
Cost Insights: Breaking Down Trane Technologies plc and W.W. Grainger, Inc.'s Expenses
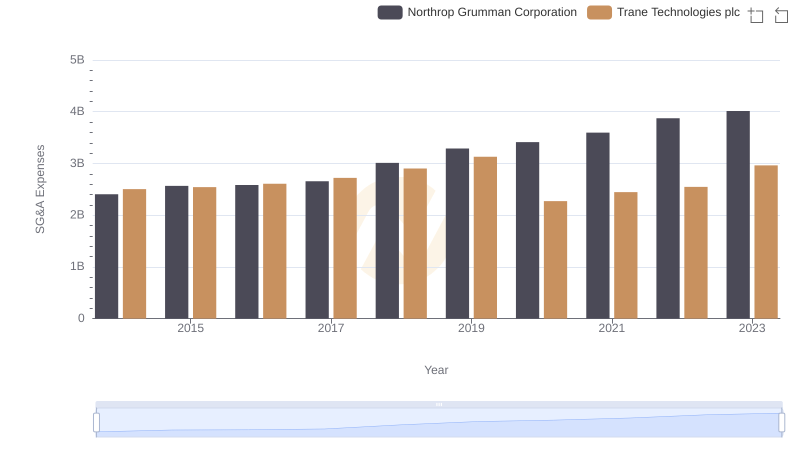
Trane Technologies plc vs Northrop Grumman Corporation: SG&A Expense Trends
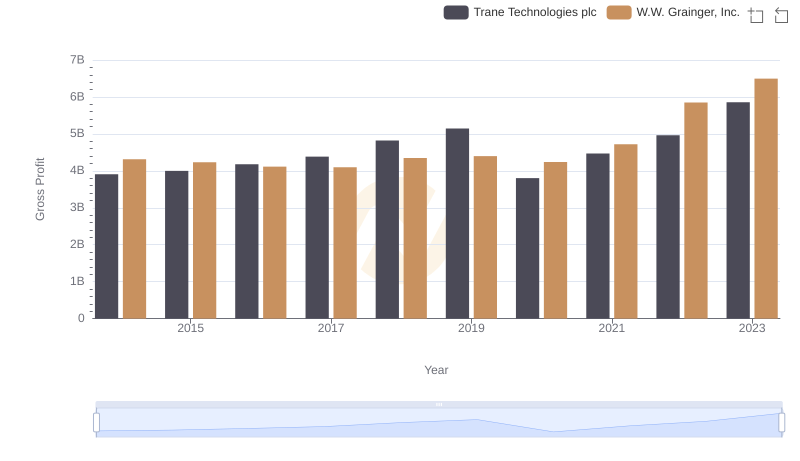
Gross Profit Comparison: Trane Technologies plc and W.W. Grainger, Inc. Trends
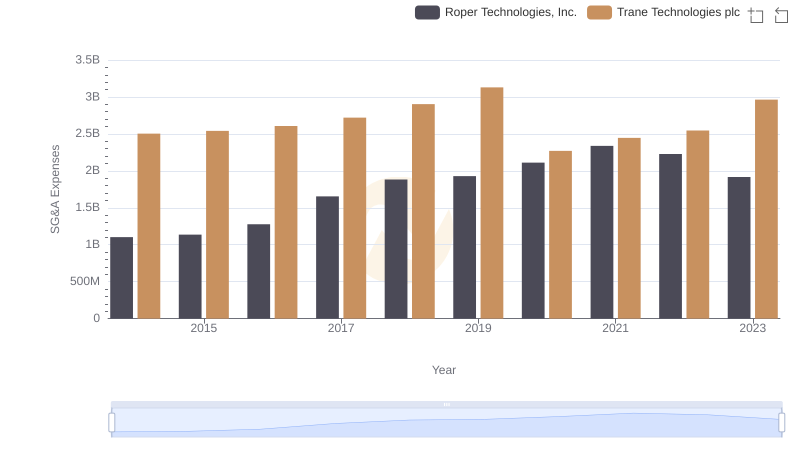
Trane Technologies plc or Roper Technologies, Inc.: Who Manages SG&A Costs Better?
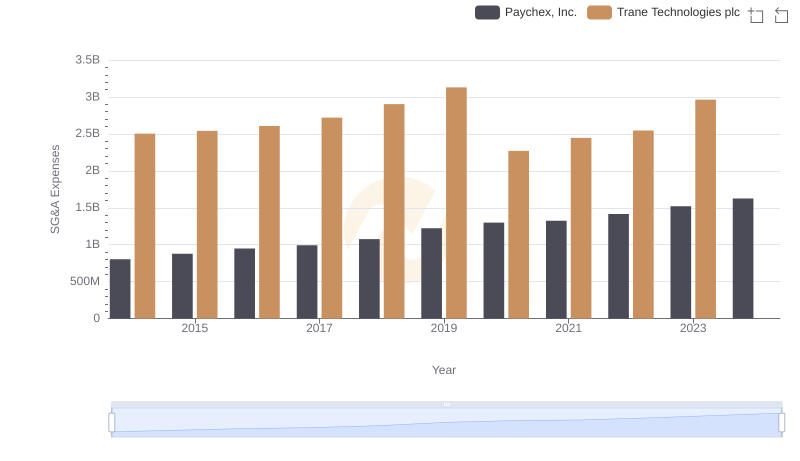
Who Optimizes SG&A Costs Better? Trane Technologies plc or Paychex, Inc.
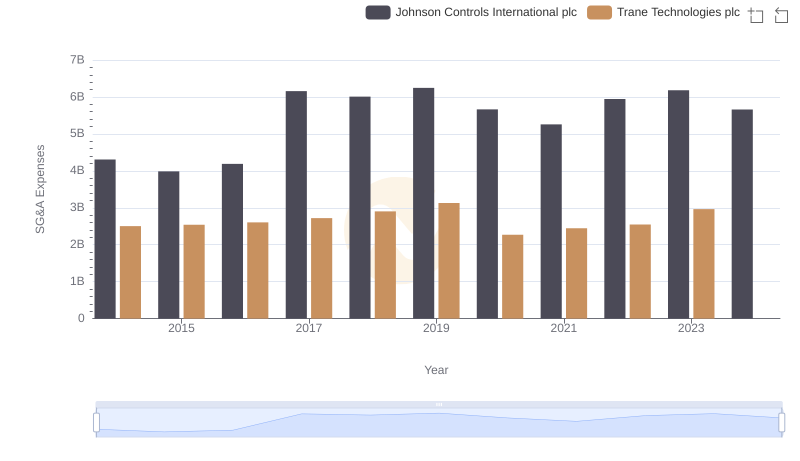
Breaking Down SG&A Expenses: Trane Technologies plc vs Johnson Controls International plc
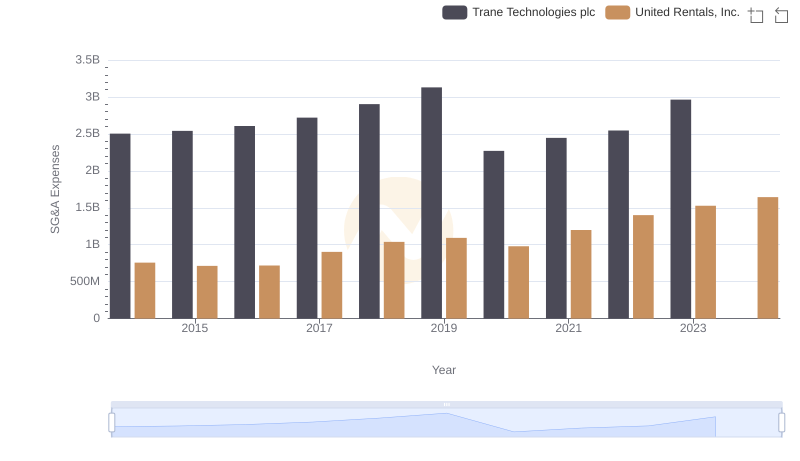
Trane Technologies plc or United Rentals, Inc.: Who Manages SG&A Costs Better?
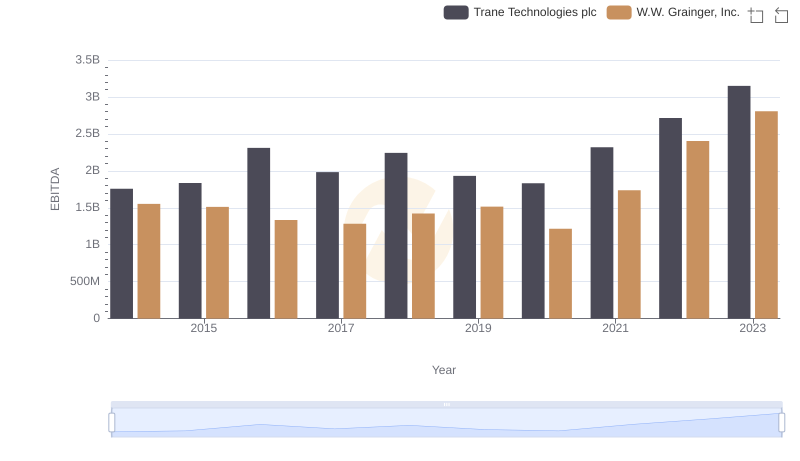
EBITDA Metrics Evaluated: Trane Technologies plc vs W.W. Grainger, Inc.
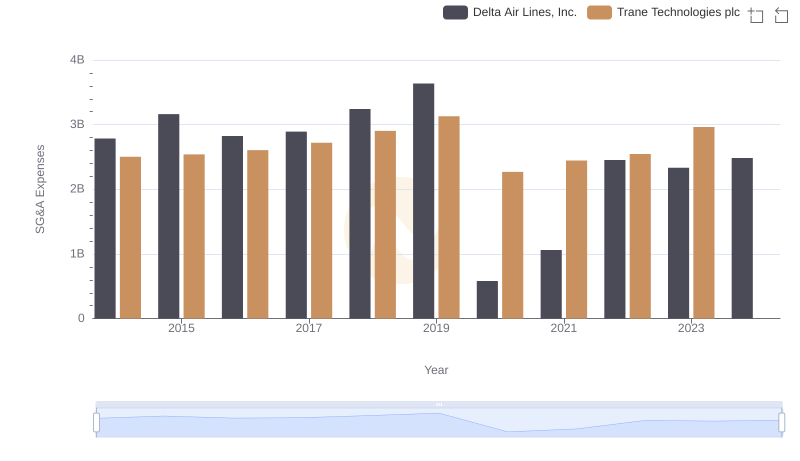
SG&A Efficiency Analysis: Comparing Trane Technologies plc and Delta Air Lines, Inc.
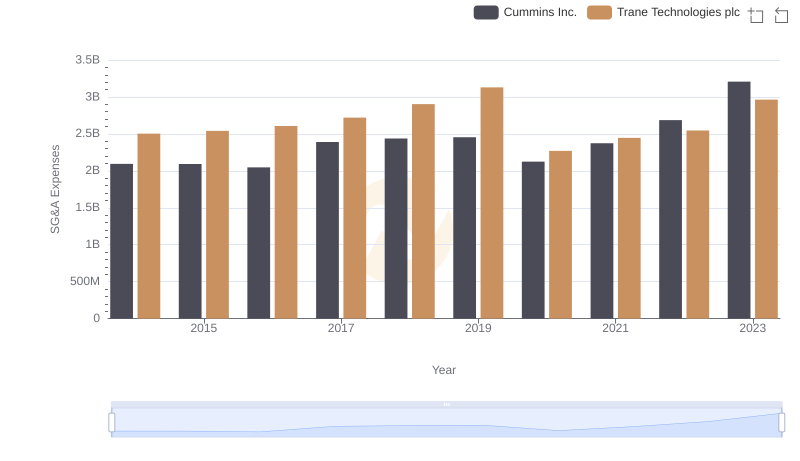
Trane Technologies plc or Cummins Inc.: Who Manages SG&A Costs Better?