| __timestamp | Northrop Grumman Corporation | Trane Technologies plc |
|---|---|---|
| Wednesday, January 1, 2014 | 2405000000 | 2503900000 |
| Thursday, January 1, 2015 | 2566000000 | 2541100000 |
| Friday, January 1, 2016 | 2584000000 | 2606500000 |
| Sunday, January 1, 2017 | 2655000000 | 2720700000 |
| Monday, January 1, 2018 | 3011000000 | 2903200000 |
| Tuesday, January 1, 2019 | 3290000000 | 3129800000 |
| Wednesday, January 1, 2020 | 3413000000 | 2270600000 |
| Friday, January 1, 2021 | 3597000000 | 2446300000 |
| Saturday, January 1, 2022 | 3873000000 | 2545900000 |
| Sunday, January 1, 2023 | 4014000000 | 2963200000 |
| Monday, January 1, 2024 | 3992000000 | 3580400000 |
Unveiling the hidden dimensions of data
In the ever-evolving landscape of corporate finance, understanding the trends in Selling, General, and Administrative (SG&A) expenses is crucial for investors and analysts alike. Over the past decade, from 2014 to 2023, Trane Technologies plc and Northrop Grumman Corporation have shown distinct trajectories in their SG&A expenses.
Northrop Grumman's SG&A expenses have surged by approximately 67%, peaking in 2023. This reflects a strategic expansion and increased operational costs. In contrast, Trane Technologies experienced a more modest increase of around 18% over the same period, with a notable dip in 2020, likely due to pandemic-related adjustments.
These trends highlight Northrop Grumman's aggressive growth strategy, while Trane Technologies appears to focus on efficiency and cost management. Investors should consider these patterns when evaluating the financial health and strategic direction of these industry giants.
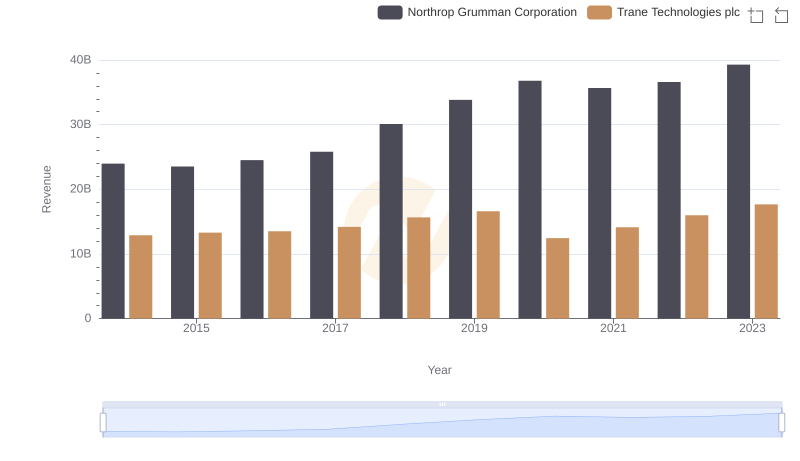
Breaking Down Revenue Trends: Trane Technologies plc vs Northrop Grumman Corporation
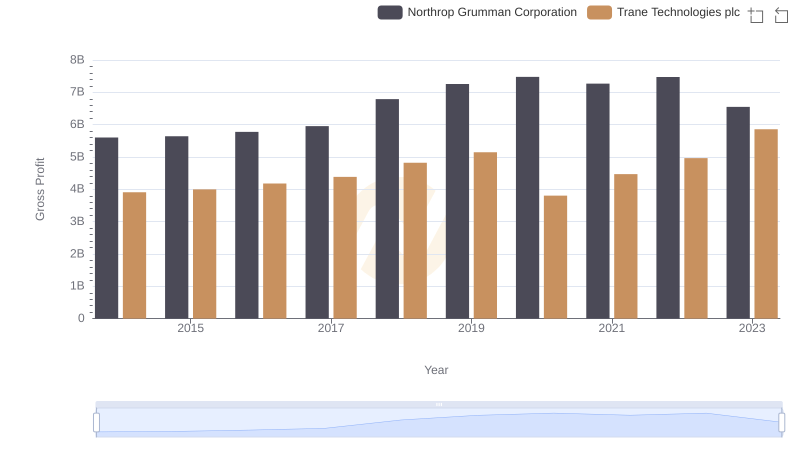
Trane Technologies plc and Northrop Grumman Corporation: A Detailed Gross Profit Analysis
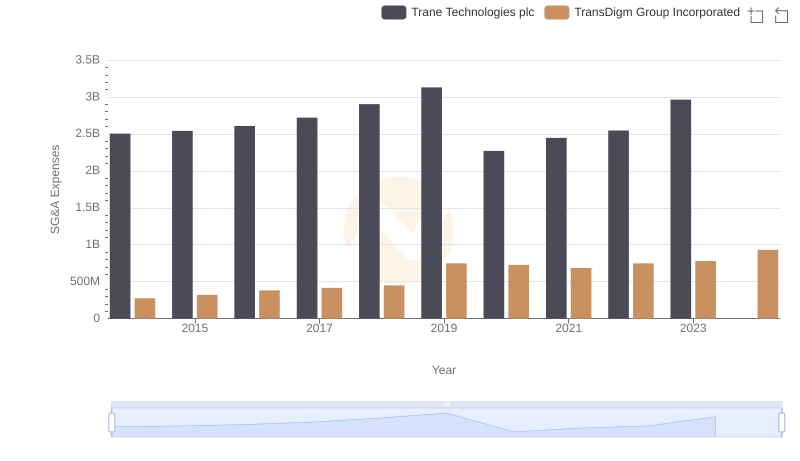
Trane Technologies plc and TransDigm Group Incorporated: SG&A Spending Patterns Compared
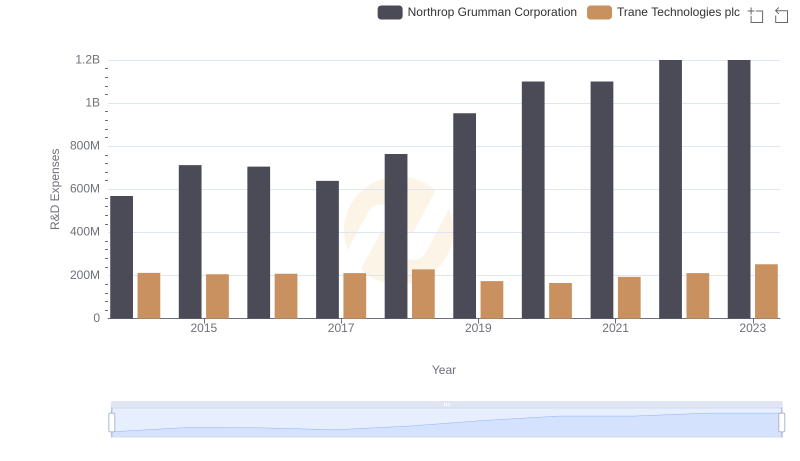
Who Prioritizes Innovation? R&D Spending Compared for Trane Technologies plc and Northrop Grumman Corporation
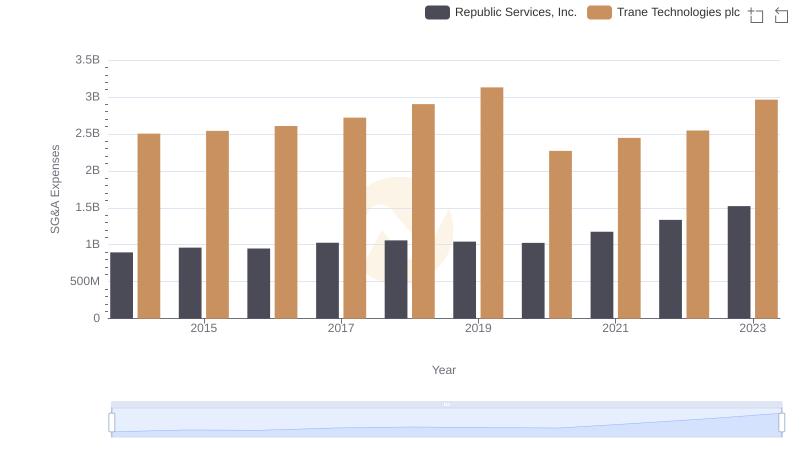
Cost Management Insights: SG&A Expenses for Trane Technologies plc and Republic Services, Inc.
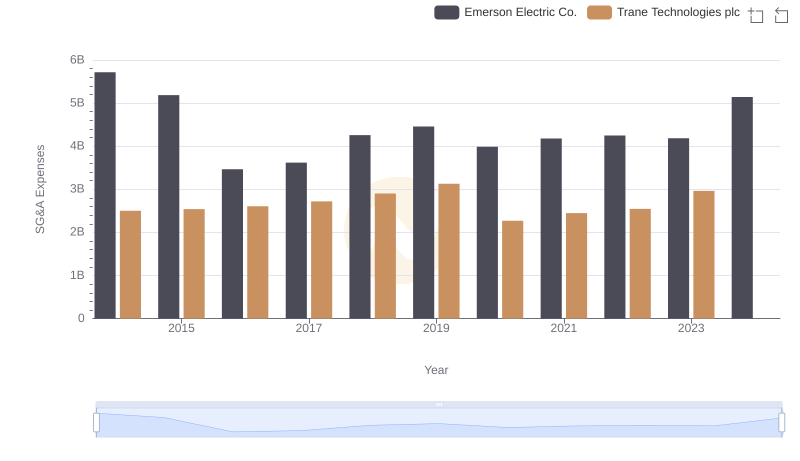
Operational Costs Compared: SG&A Analysis of Trane Technologies plc and Emerson Electric Co.
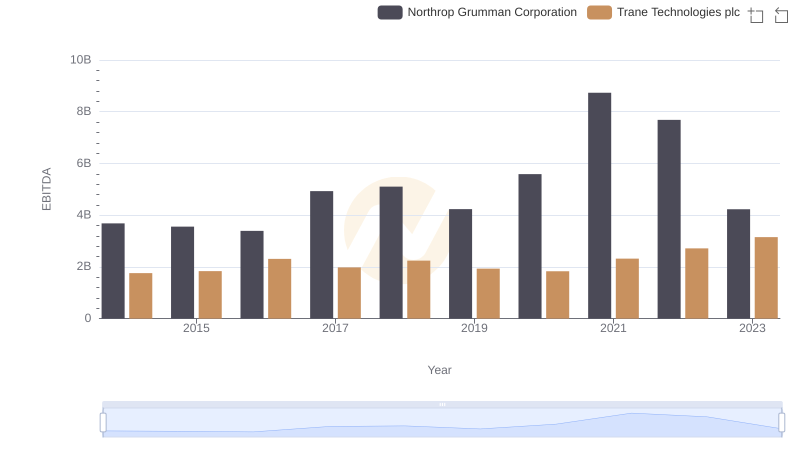
Trane Technologies plc and Northrop Grumman Corporation: A Detailed Examination of EBITDA Performance
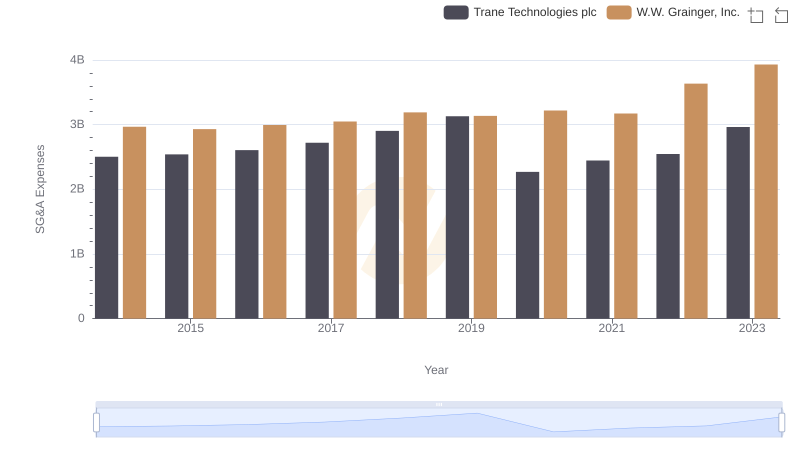
Who Optimizes SG&A Costs Better? Trane Technologies plc or W.W. Grainger, Inc.