| __timestamp | Trane Technologies plc | W.W. Grainger, Inc. |
|---|---|---|
| Wednesday, January 1, 2014 | 8982800000 | 5650711000 |
| Thursday, January 1, 2015 | 9301600000 | 5741956000 |
| Friday, January 1, 2016 | 9329300000 | 6022647000 |
| Sunday, January 1, 2017 | 9811600000 | 6327301000 |
| Monday, January 1, 2018 | 10847600000 | 6873000000 |
| Tuesday, January 1, 2019 | 11451500000 | 7089000000 |
| Wednesday, January 1, 2020 | 8651300000 | 7559000000 |
| Friday, January 1, 2021 | 9666800000 | 8302000000 |
| Saturday, January 1, 2022 | 11026900000 | 9379000000 |
| Sunday, January 1, 2023 | 11820400000 | 9982000000 |
| Monday, January 1, 2024 | 12757700000 | 10410000000 |
Unlocking the unknown
Over the past decade, Trane Technologies plc and W.W. Grainger, Inc. have demonstrated intriguing trends in their cost structures. From 2014 to 2023, Trane Technologies saw a 32% increase in its Cost of Revenue, peaking at approximately $11.8 billion in 2023. Meanwhile, W.W. Grainger experienced a 77% surge, reaching nearly $10 billion in the same year.
These trends reflect strategic shifts and market dynamics, offering valuable insights for investors and industry analysts alike.
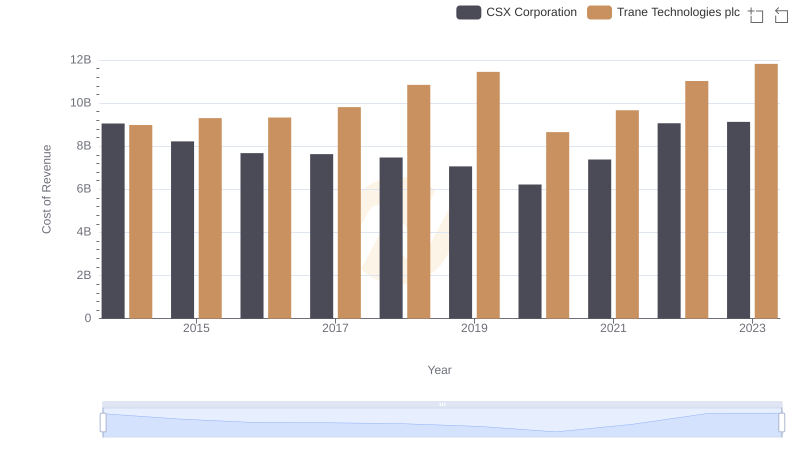
Cost of Revenue Trends: Trane Technologies plc vs CSX Corporation
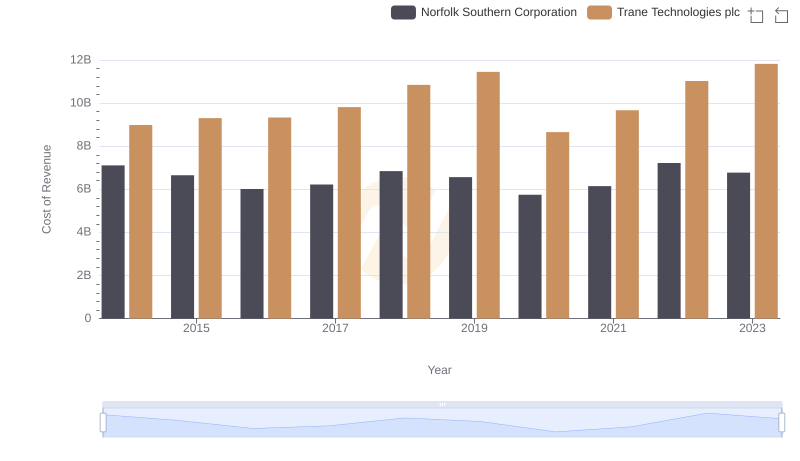
Analyzing Cost of Revenue: Trane Technologies plc and Norfolk Southern Corporation
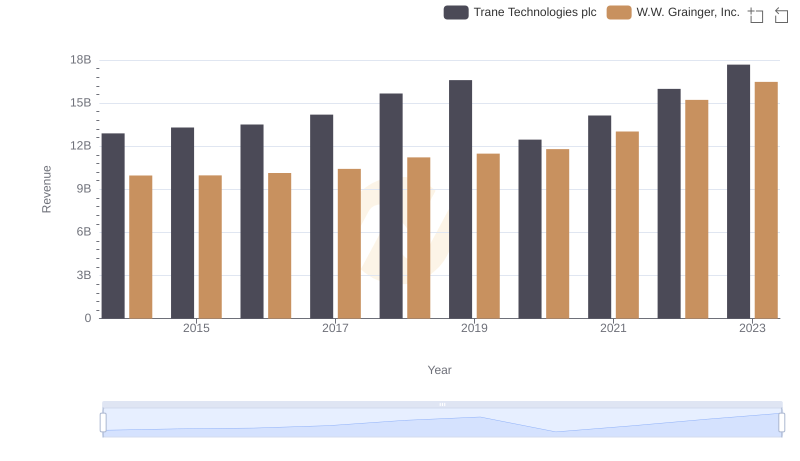
Annual Revenue Comparison: Trane Technologies plc vs W.W. Grainger, Inc.
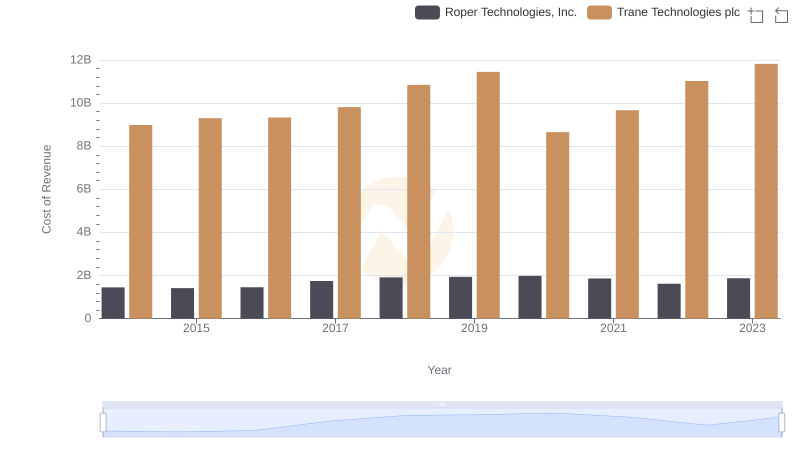
Cost of Revenue Comparison: Trane Technologies plc vs Roper Technologies, Inc.
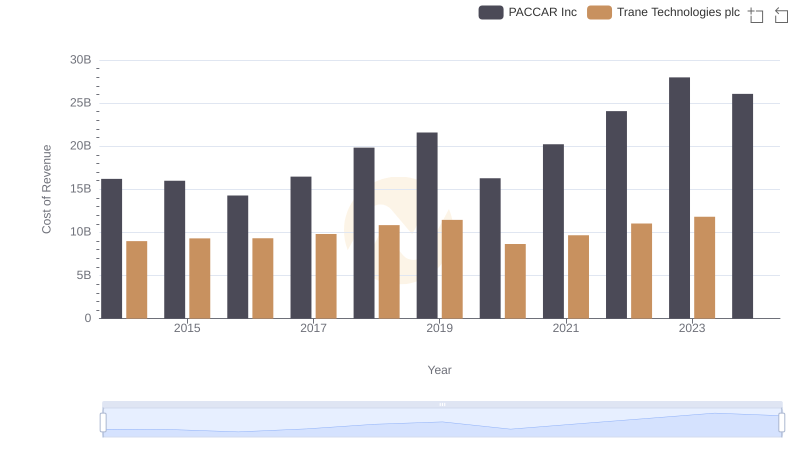
Cost Insights: Breaking Down Trane Technologies plc and PACCAR Inc's Expenses
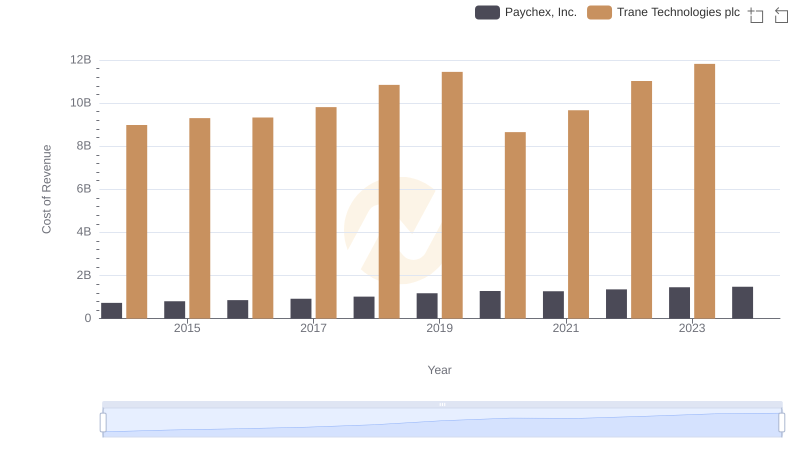
Cost Insights: Breaking Down Trane Technologies plc and Paychex, Inc.'s Expenses
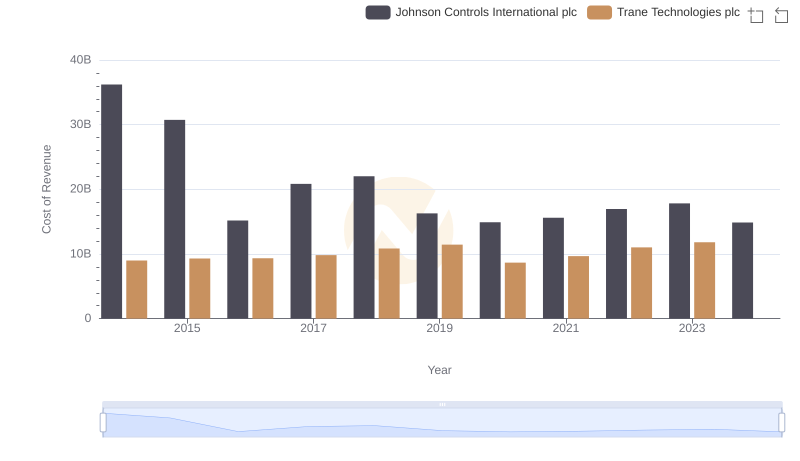
Cost of Revenue Comparison: Trane Technologies plc vs Johnson Controls International plc
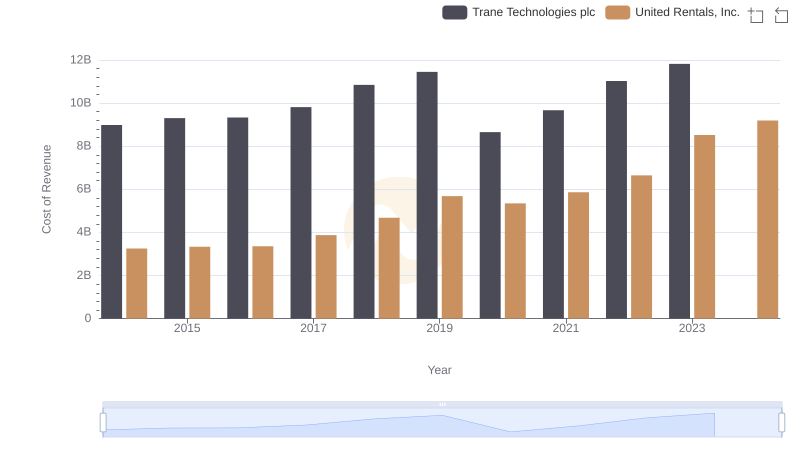
Cost of Revenue Trends: Trane Technologies plc vs United Rentals, Inc.
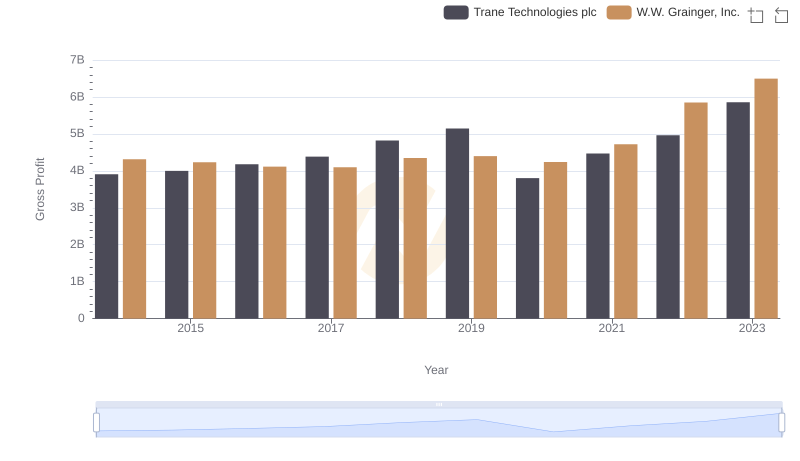
Gross Profit Comparison: Trane Technologies plc and W.W. Grainger, Inc. Trends
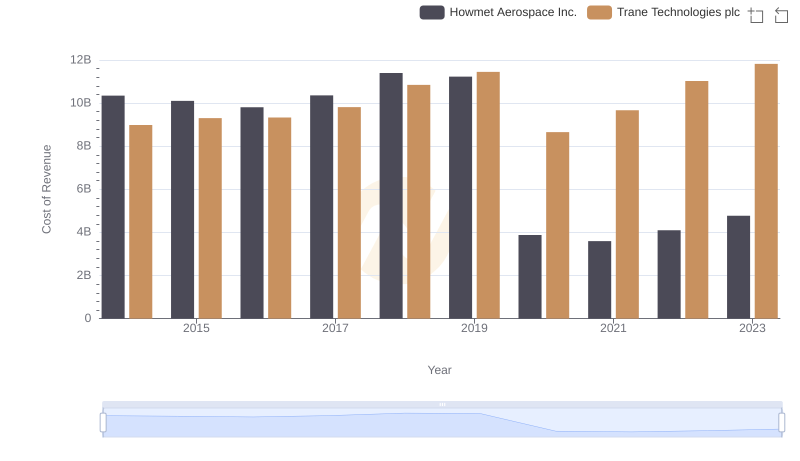
Cost of Revenue Trends: Trane Technologies plc vs Howmet Aerospace Inc.
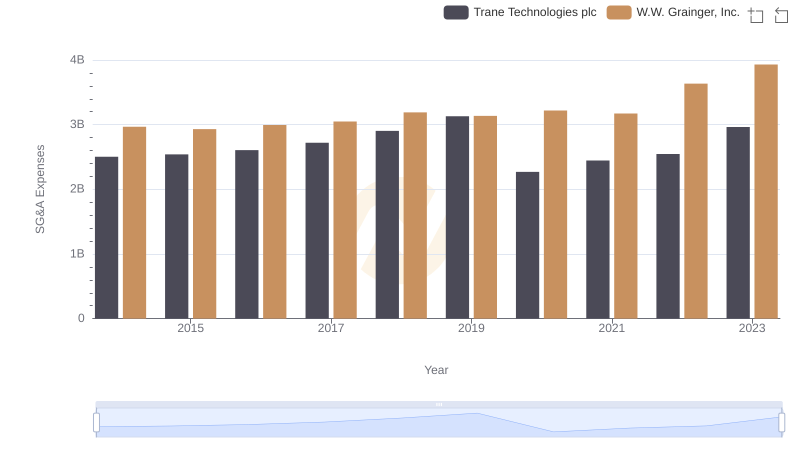
Who Optimizes SG&A Costs Better? Trane Technologies plc or W.W. Grainger, Inc.
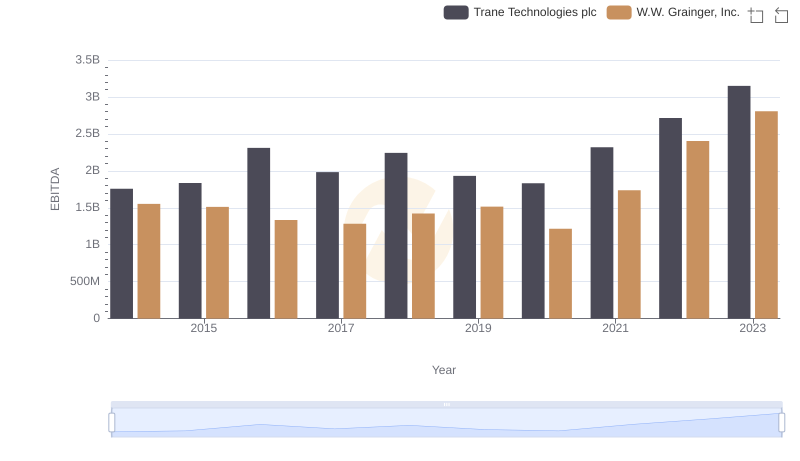
EBITDA Metrics Evaluated: Trane Technologies plc vs W.W. Grainger, Inc.