| __timestamp | Delta Air Lines, Inc. | Trane Technologies plc |
|---|---|---|
| Wednesday, January 1, 2014 | 2785000000 | 2503900000 |
| Thursday, January 1, 2015 | 3162000000 | 2541100000 |
| Friday, January 1, 2016 | 2825000000 | 2606500000 |
| Sunday, January 1, 2017 | 2892000000 | 2720700000 |
| Monday, January 1, 2018 | 3242000000 | 2903200000 |
| Tuesday, January 1, 2019 | 3636000000 | 3129800000 |
| Wednesday, January 1, 2020 | 582000000 | 2270600000 |
| Friday, January 1, 2021 | 1061000000 | 2446300000 |
| Saturday, January 1, 2022 | 2454000000 | 2545900000 |
| Sunday, January 1, 2023 | 2334000000 | 2963200000 |
| Monday, January 1, 2024 | 2485000000 | 3580400000 |
Unveiling the hidden dimensions of data
In the ever-evolving landscape of corporate finance, understanding the efficiency of Selling, General, and Administrative (SG&A) expenses is crucial. Trane Technologies plc and Delta Air Lines, Inc. offer a fascinating study in contrasts over the past decade. From 2014 to 2023, Delta Air Lines saw a significant fluctuation in SG&A expenses, peaking in 2019 before a dramatic drop in 2020, likely due to the pandemic's impact. In contrast, Trane Technologies maintained a more stable trajectory, with a notable increase in 2023, reaching its highest efficiency.
This analysis underscores the importance of adaptive strategies in maintaining financial health amidst global disruptions.
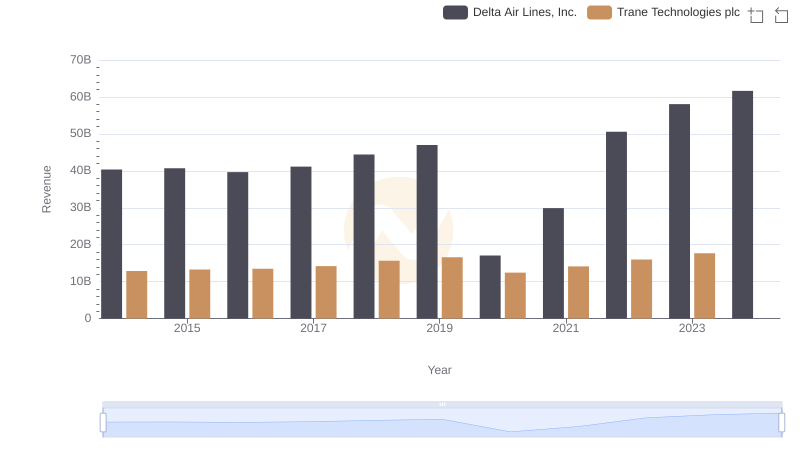
Who Generates More Revenue? Trane Technologies plc or Delta Air Lines, Inc.
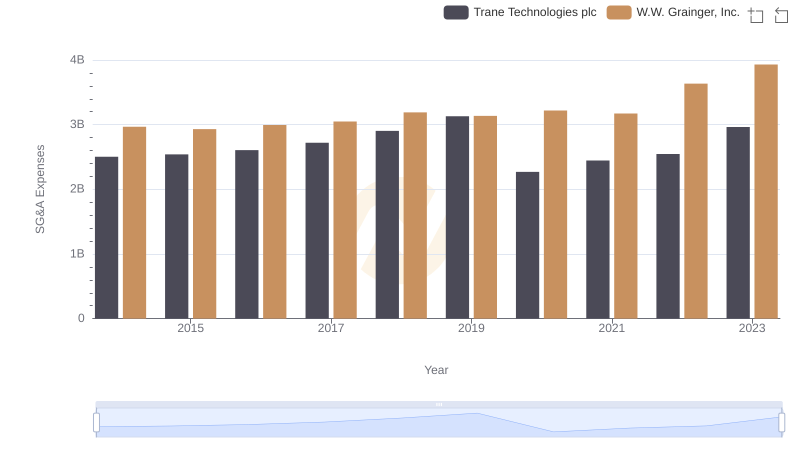
Who Optimizes SG&A Costs Better? Trane Technologies plc or W.W. Grainger, Inc.
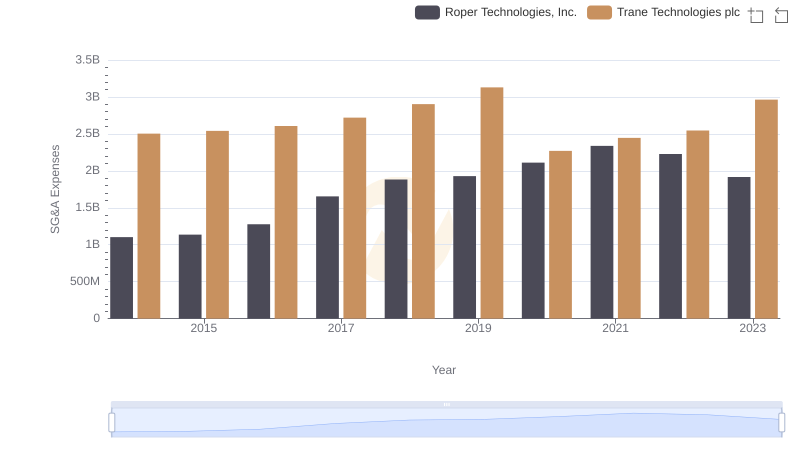
Trane Technologies plc or Roper Technologies, Inc.: Who Manages SG&A Costs Better?
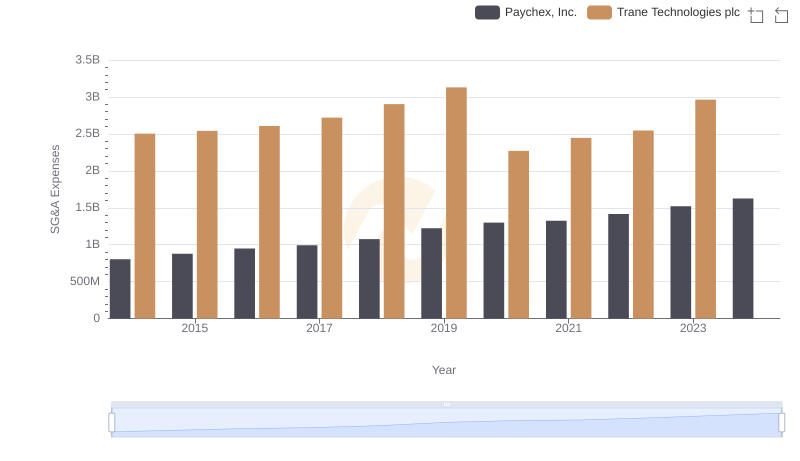
Who Optimizes SG&A Costs Better? Trane Technologies plc or Paychex, Inc.
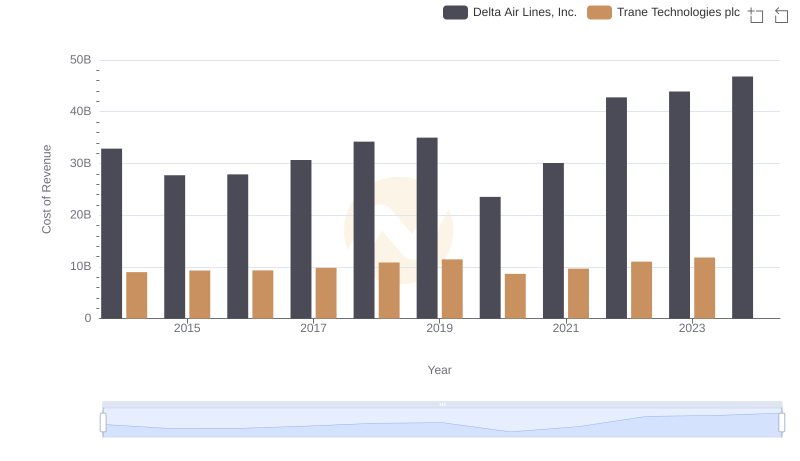
Analyzing Cost of Revenue: Trane Technologies plc and Delta Air Lines, Inc.
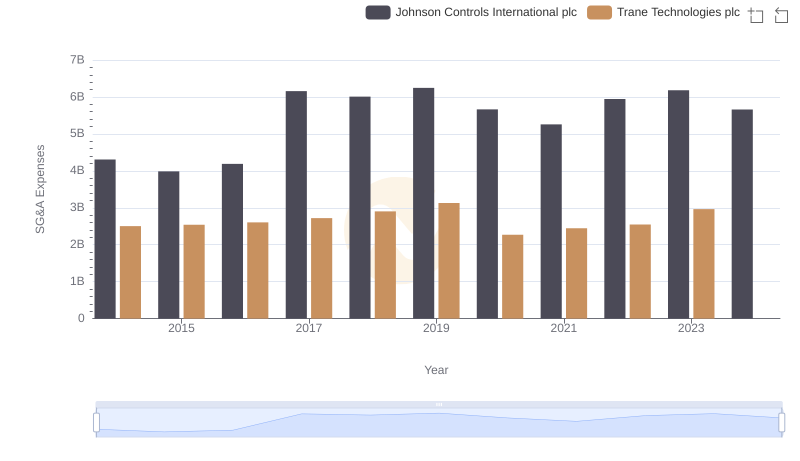
Breaking Down SG&A Expenses: Trane Technologies plc vs Johnson Controls International plc
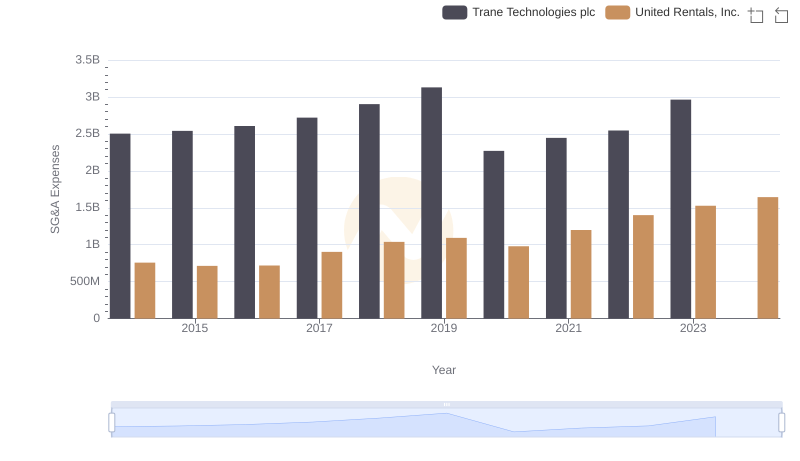
Trane Technologies plc or United Rentals, Inc.: Who Manages SG&A Costs Better?
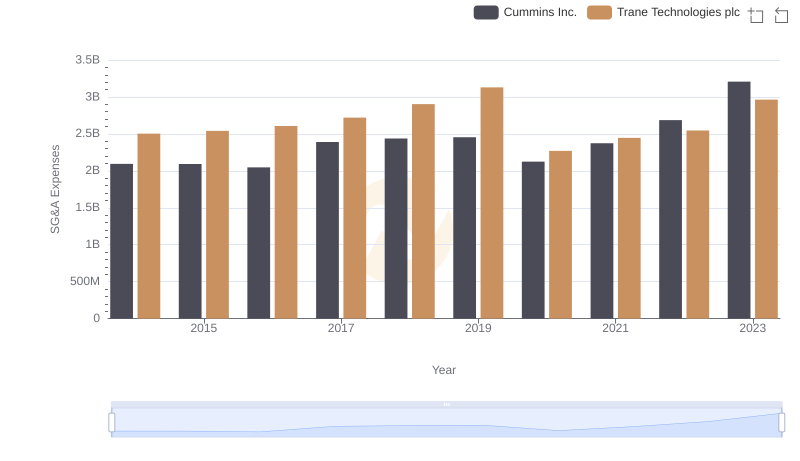
Trane Technologies plc or Cummins Inc.: Who Manages SG&A Costs Better?
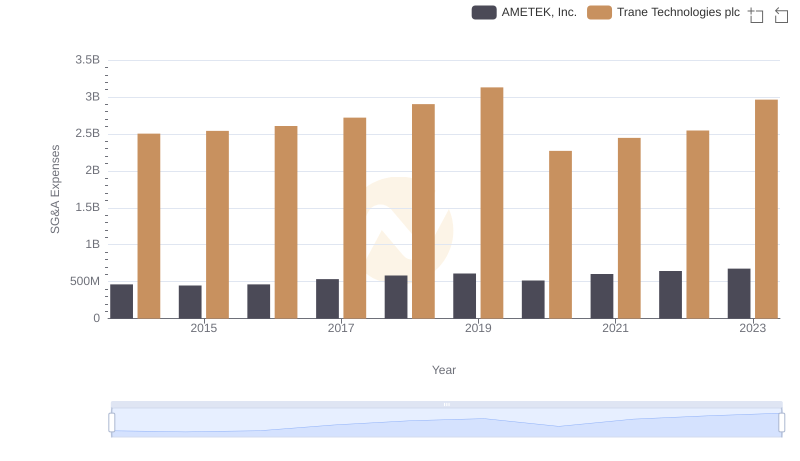
Trane Technologies plc vs AMETEK, Inc.: SG&A Expense Trends
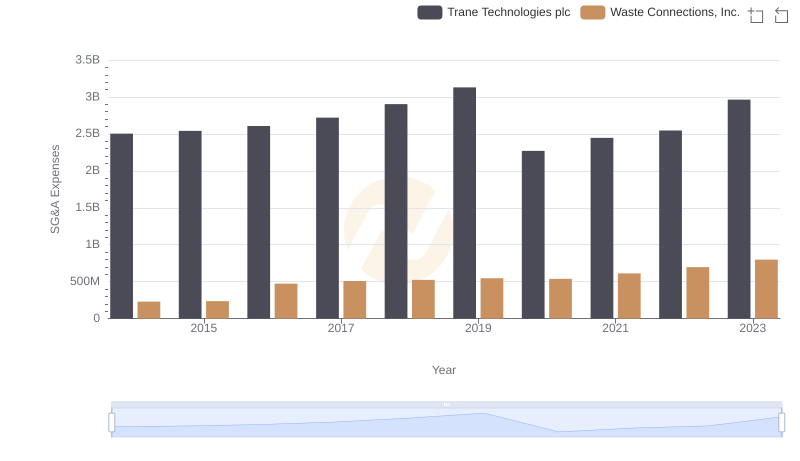
Cost Management Insights: SG&A Expenses for Trane Technologies plc and Waste Connections, Inc.