| __timestamp | Johnson Controls International plc | Trane Technologies plc |
|---|---|---|
| Wednesday, January 1, 2014 | 4308000000 | 2503900000 |
| Thursday, January 1, 2015 | 3986000000 | 2541100000 |
| Friday, January 1, 2016 | 4190000000 | 2606500000 |
| Sunday, January 1, 2017 | 6158000000 | 2720700000 |
| Monday, January 1, 2018 | 6010000000 | 2903200000 |
| Tuesday, January 1, 2019 | 6244000000 | 3129800000 |
| Wednesday, January 1, 2020 | 5665000000 | 2270600000 |
| Friday, January 1, 2021 | 5258000000 | 2446300000 |
| Saturday, January 1, 2022 | 5945000000 | 2545900000 |
| Sunday, January 1, 2023 | 6181000000 | 2963200000 |
| Monday, January 1, 2024 | 5661000000 | 3580400000 |
Unleashing insights
In the ever-evolving landscape of industrial technology, understanding the financial health of key players is crucial. Trane Technologies plc and Johnson Controls International plc, two giants in the sector, have shown distinct trends in their Selling, General, and Administrative (SG&A) expenses over the past decade. From 2014 to 2023, Johnson Controls consistently reported higher SG&A expenses, peaking in 2019 with a 45% increase from 2014. In contrast, Trane Technologies exhibited a more stable trajectory, with a notable dip in 2020, reflecting a 27% decrease from the previous year, likely due to global economic shifts. By 2023, Trane's expenses rebounded, nearing their 2019 levels. This analysis highlights the strategic financial maneuvers of these companies, offering insights into their operational efficiencies and market strategies. Missing data for 2024 suggests ongoing adjustments, inviting further scrutiny into their future financial strategies.
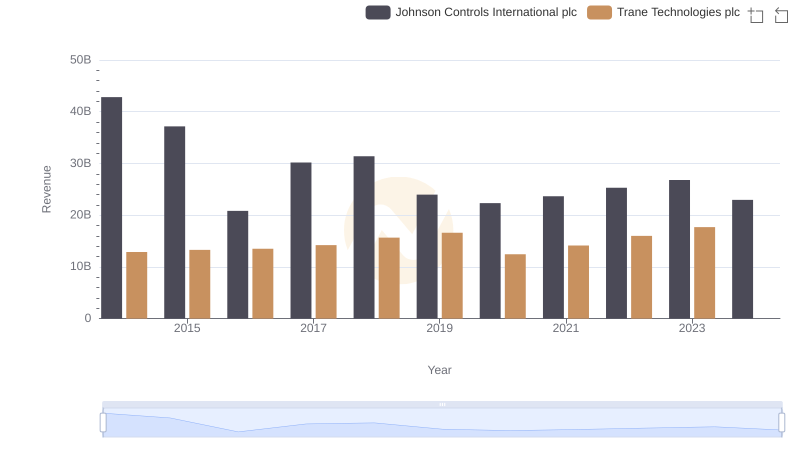
Revenue Insights: Trane Technologies plc and Johnson Controls International plc Performance Compared
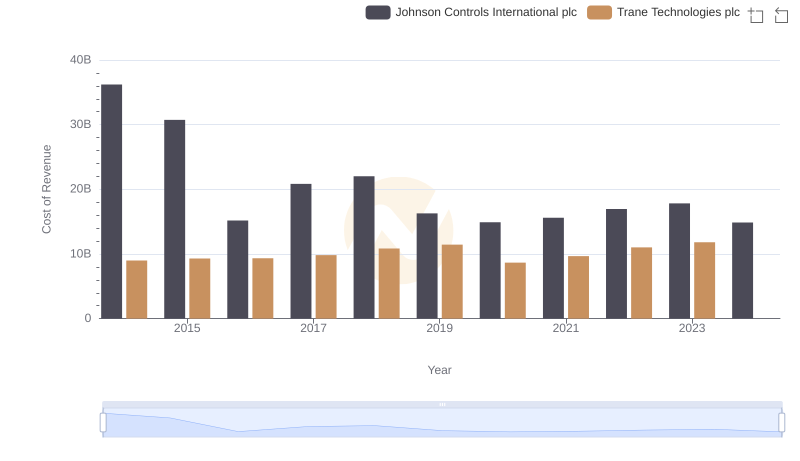
Cost of Revenue Comparison: Trane Technologies plc vs Johnson Controls International plc
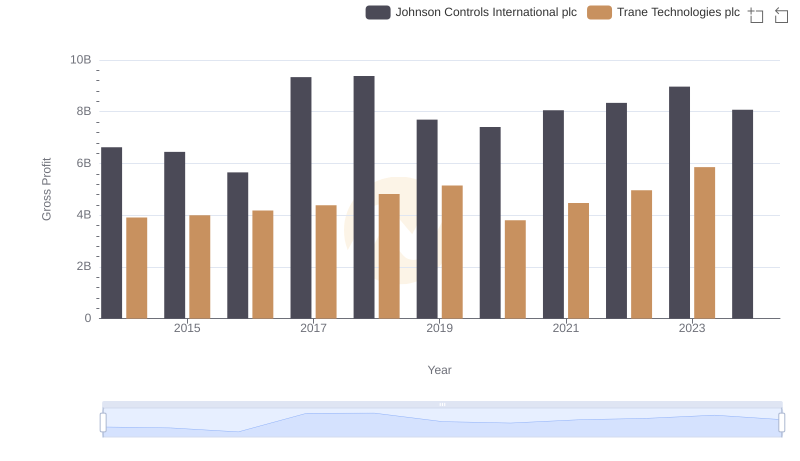
Trane Technologies plc and Johnson Controls International plc: A Detailed Gross Profit Analysis
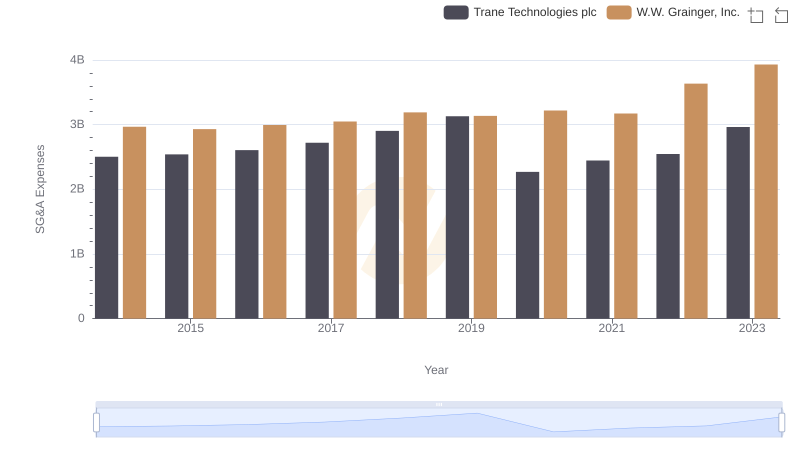
Who Optimizes SG&A Costs Better? Trane Technologies plc or W.W. Grainger, Inc.
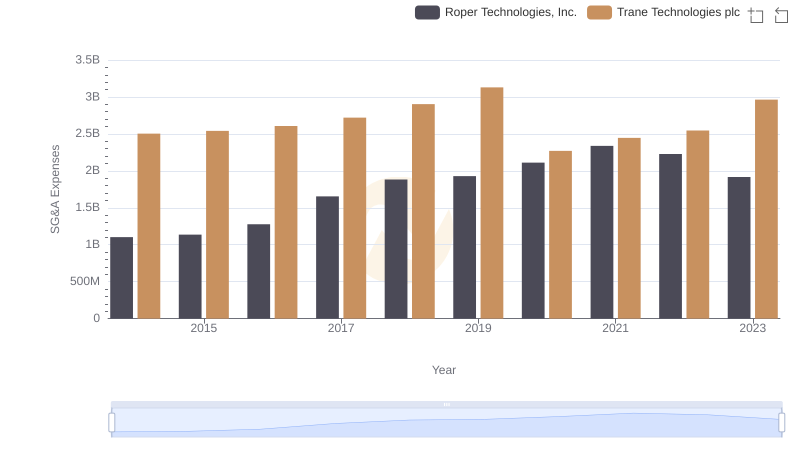
Trane Technologies plc or Roper Technologies, Inc.: Who Manages SG&A Costs Better?
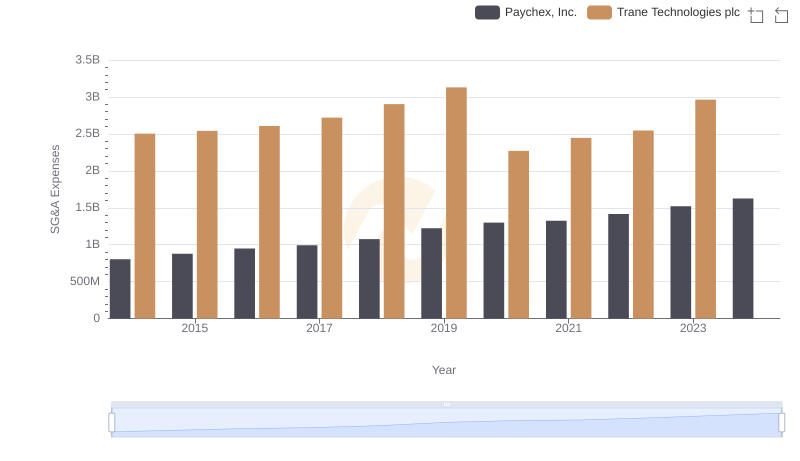
Who Optimizes SG&A Costs Better? Trane Technologies plc or Paychex, Inc.
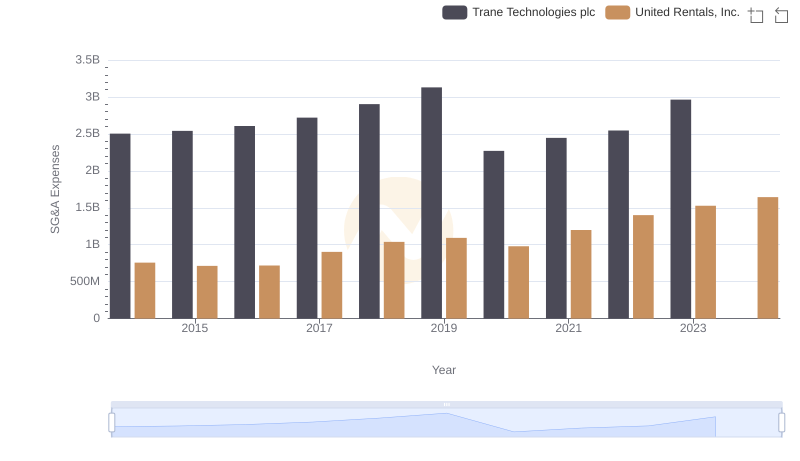
Trane Technologies plc or United Rentals, Inc.: Who Manages SG&A Costs Better?
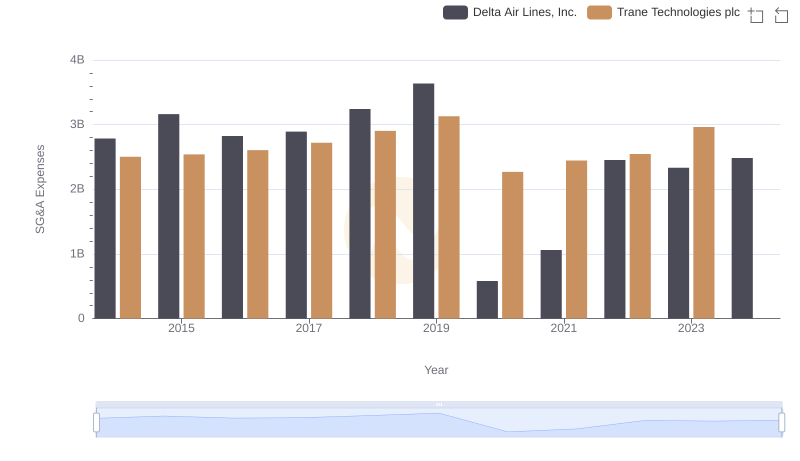
SG&A Efficiency Analysis: Comparing Trane Technologies plc and Delta Air Lines, Inc.
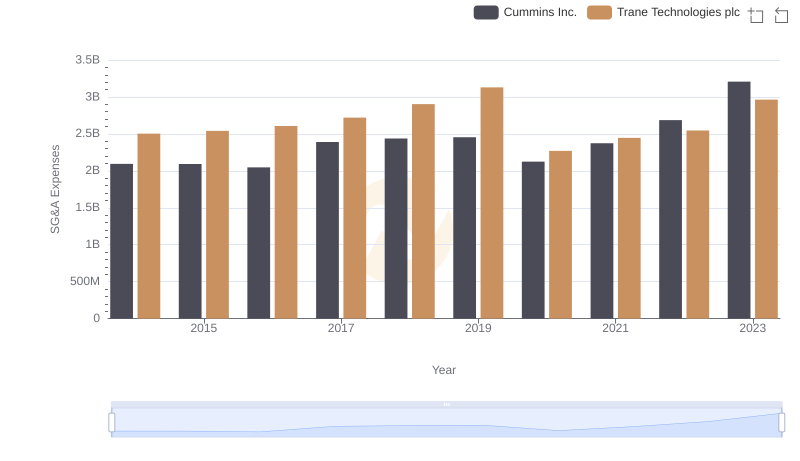
Trane Technologies plc or Cummins Inc.: Who Manages SG&A Costs Better?
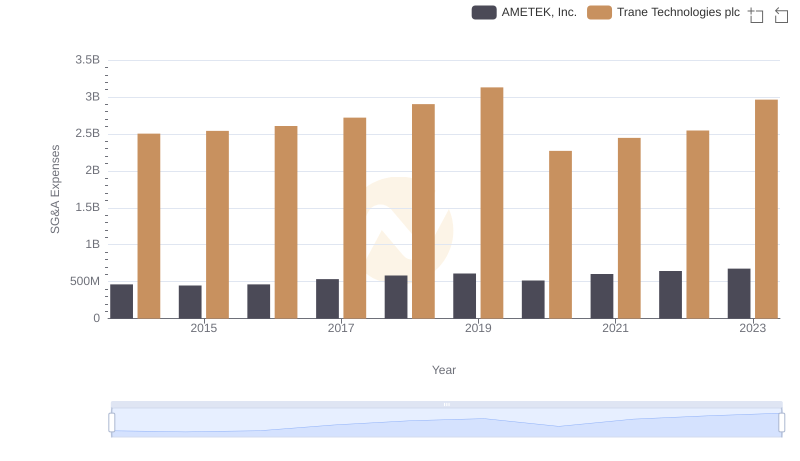
Trane Technologies plc vs AMETEK, Inc.: SG&A Expense Trends