| __timestamp | Trane Technologies plc | W.W. Grainger, Inc. |
|---|---|---|
| Wednesday, January 1, 2014 | 12891400000 | 9964953000 |
| Thursday, January 1, 2015 | 13300700000 | 9973384000 |
| Friday, January 1, 2016 | 13508900000 | 10137204000 |
| Sunday, January 1, 2017 | 14197600000 | 10424858000 |
| Monday, January 1, 2018 | 15668200000 | 11221000000 |
| Tuesday, January 1, 2019 | 16598900000 | 11486000000 |
| Wednesday, January 1, 2020 | 12454700000 | 11797000000 |
| Friday, January 1, 2021 | 14136400000 | 13022000000 |
| Saturday, January 1, 2022 | 15991700000 | 15228000000 |
| Sunday, January 1, 2023 | 17677600000 | 16478000000 |
| Monday, January 1, 2024 | 19838200000 | 17168000000 |
Unleashing the power of data
In the ever-evolving landscape of industrial giants, Trane Technologies plc and W.W. Grainger, Inc. have showcased remarkable revenue trajectories over the past decade. From 2014 to 2023, Trane Technologies has seen its annual revenue soar by approximately 37%, reflecting its robust market strategies and innovation-driven growth. Meanwhile, W.W. Grainger has not lagged far behind, with a commendable revenue increase of around 65% during the same period.
This comparison highlights the resilience and adaptability of these industrial leaders, setting a benchmark for others in the sector.
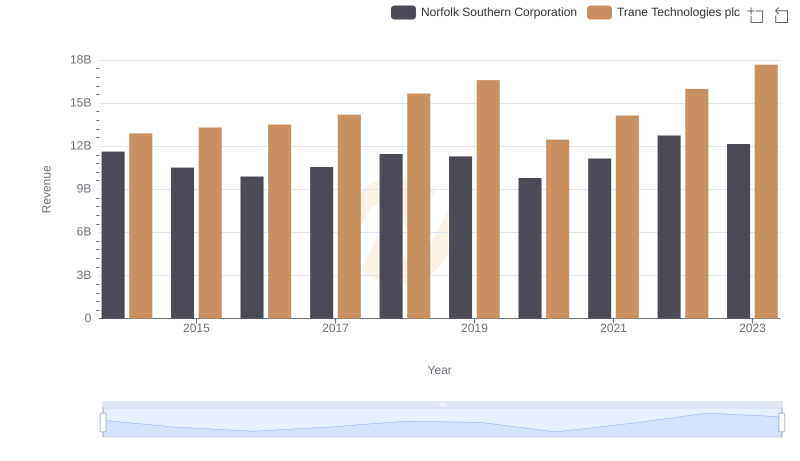
Trane Technologies plc and Norfolk Southern Corporation: A Comprehensive Revenue Analysis
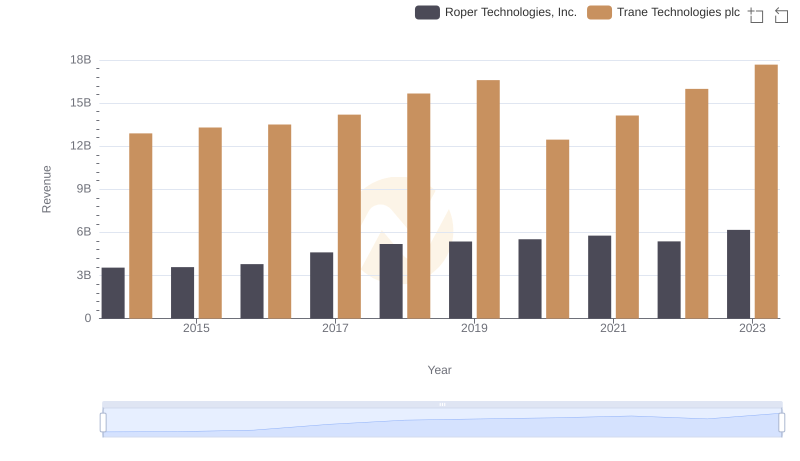
Trane Technologies plc vs Roper Technologies, Inc.: Examining Key Revenue Metrics

Revenue Insights: Trane Technologies plc and PACCAR Inc Performance Compared
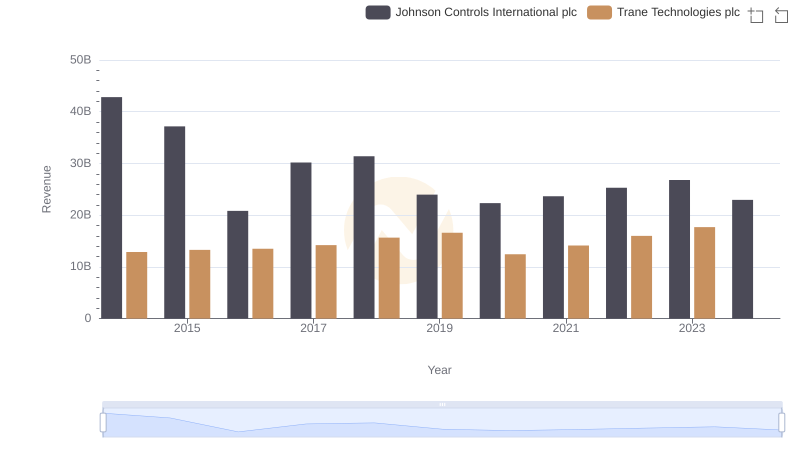
Revenue Insights: Trane Technologies plc and Johnson Controls International plc Performance Compared
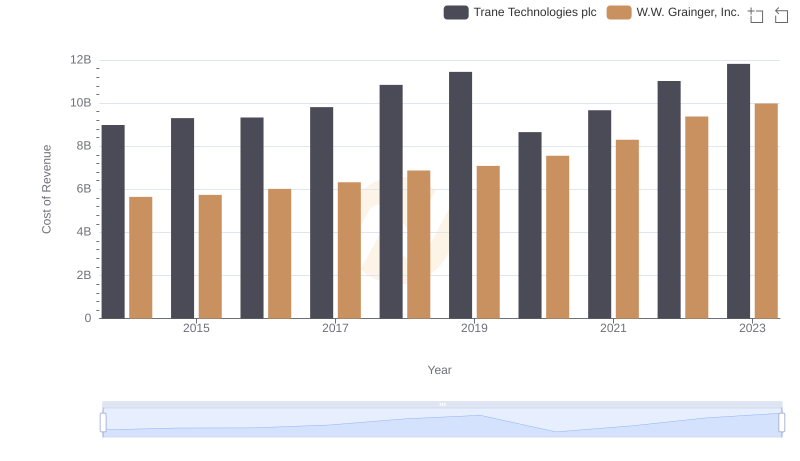
Cost Insights: Breaking Down Trane Technologies plc and W.W. Grainger, Inc.'s Expenses
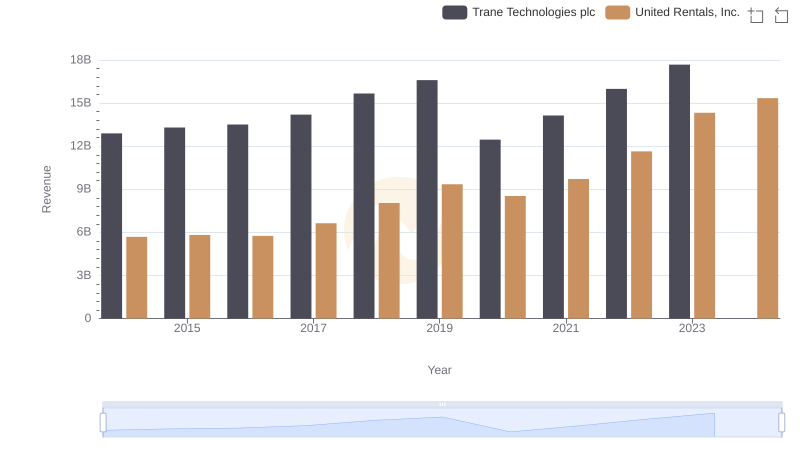
Who Generates More Revenue? Trane Technologies plc or United Rentals, Inc.
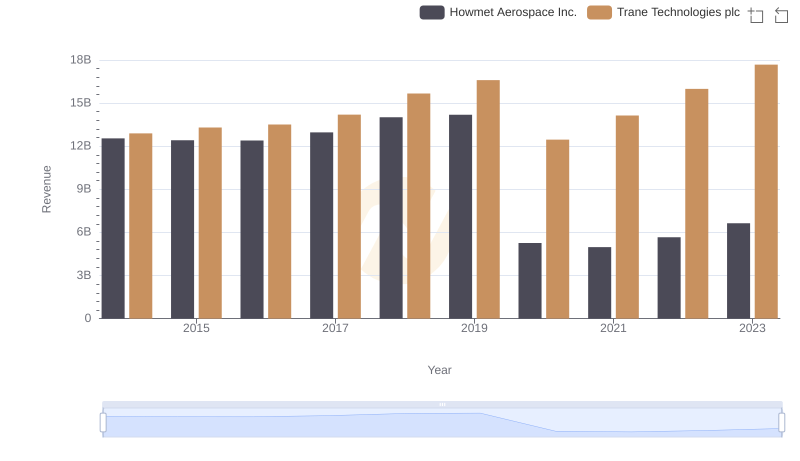
Breaking Down Revenue Trends: Trane Technologies plc vs Howmet Aerospace Inc.
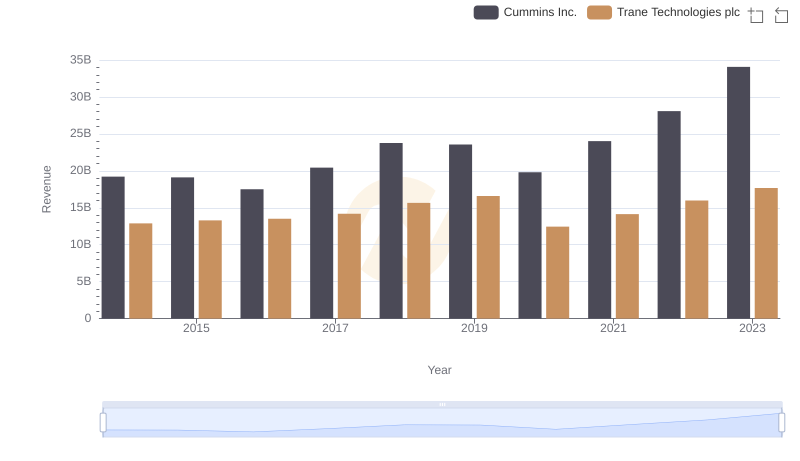
Revenue Showdown: Trane Technologies plc vs Cummins Inc.
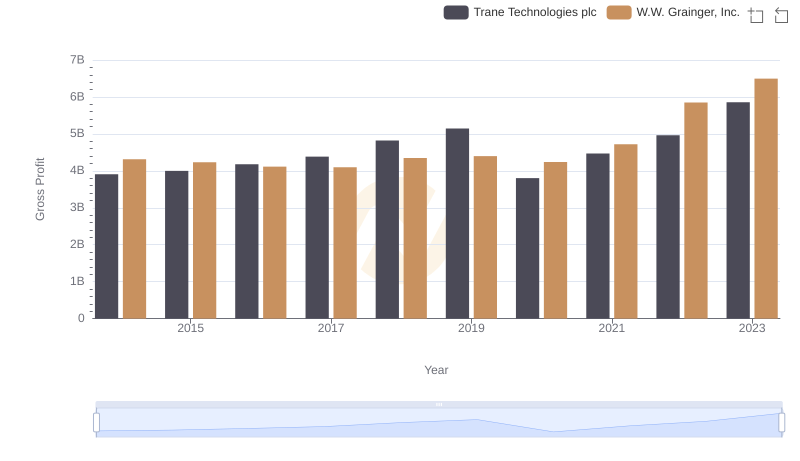
Gross Profit Comparison: Trane Technologies plc and W.W. Grainger, Inc. Trends
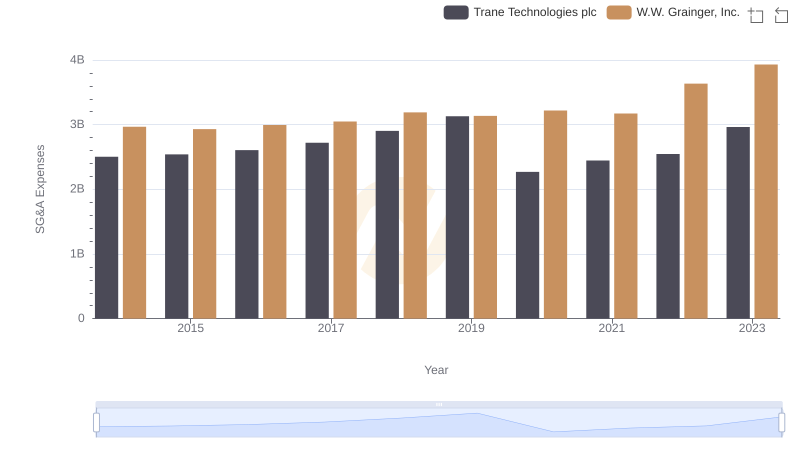
Who Optimizes SG&A Costs Better? Trane Technologies plc or W.W. Grainger, Inc.
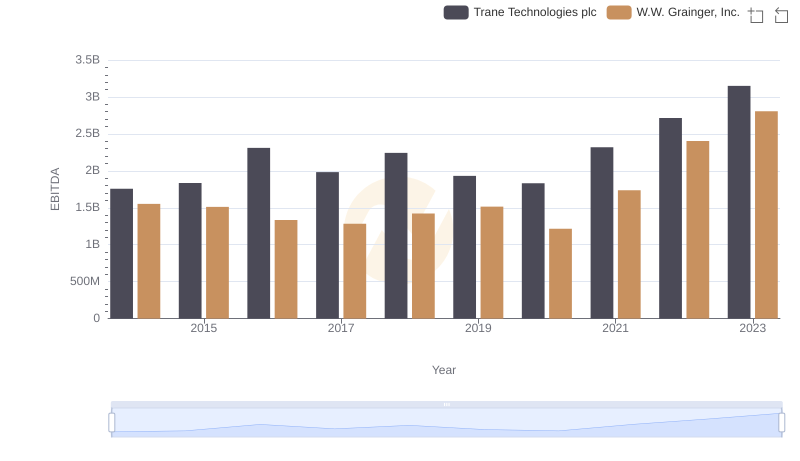
EBITDA Metrics Evaluated: Trane Technologies plc vs W.W. Grainger, Inc.