| __timestamp | Union Pacific Corporation | United Rentals, Inc. |
|---|---|---|
| Wednesday, January 1, 2014 | 14311000000 | 3253000000 |
| Thursday, January 1, 2015 | 12837000000 | 3337000000 |
| Friday, January 1, 2016 | 11672000000 | 3359000000 |
| Sunday, January 1, 2017 | 12231000000 | 3872000000 |
| Monday, January 1, 2018 | 13293000000 | 4683000000 |
| Tuesday, January 1, 2019 | 12094000000 | 5681000000 |
| Wednesday, January 1, 2020 | 10354000000 | 5347000000 |
| Friday, January 1, 2021 | 11290000000 | 5863000000 |
| Saturday, January 1, 2022 | 13670000000 | 6646000000 |
| Sunday, January 1, 2023 | 13590000000 | 8519000000 |
| Monday, January 1, 2024 | 13211000000 | 9195000000 |
Infusing magic into the data realm
In the ever-evolving landscape of American industry, Union Pacific Corporation and United Rentals, Inc. stand as titans in their respective fields. Over the past decade, from 2014 to 2024, these companies have showcased contrasting trajectories in their cost of revenue. Union Pacific, a stalwart in the railroad sector, has seen a gradual decline in its cost of revenue, dropping approximately 8% from its peak in 2014. Meanwhile, United Rentals, a leader in equipment rental, has experienced a remarkable surge, with costs nearly tripling, reflecting its aggressive expansion and market penetration.
This comparison not only highlights the strategic differences between a traditional transportation giant and a dynamic rental service provider but also underscores the broader economic shifts influencing these sectors. As we look to the future, understanding these trends offers valuable insights into the operational efficiencies and market strategies of these industry leaders.
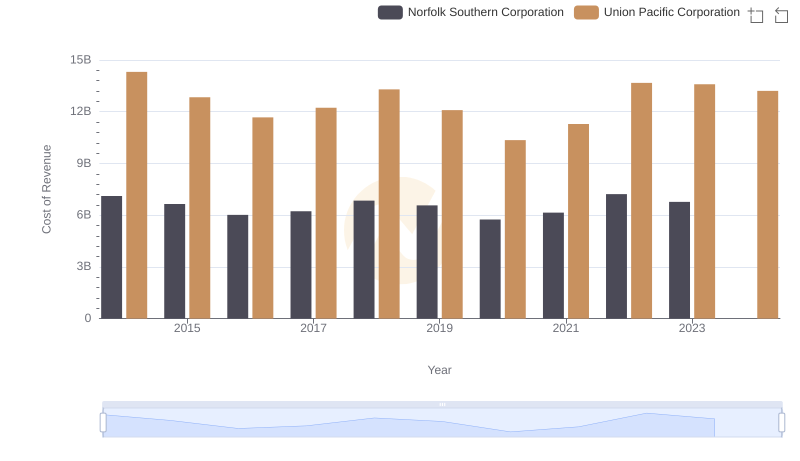
Cost Insights: Breaking Down Union Pacific Corporation and Norfolk Southern Corporation's Expenses
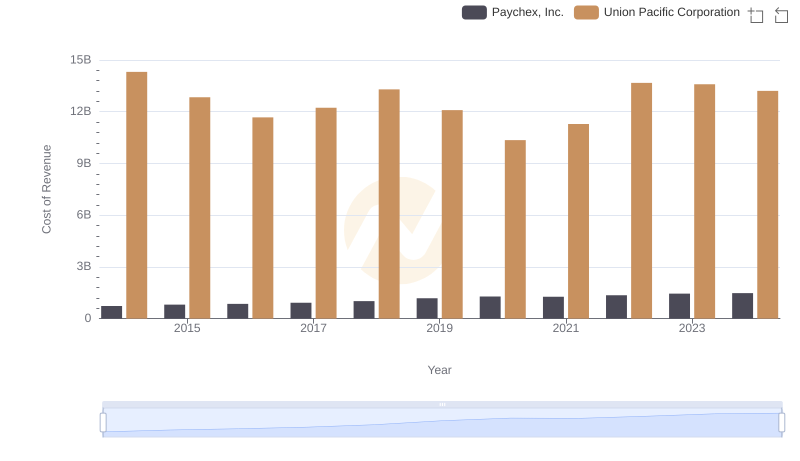
Analyzing Cost of Revenue: Union Pacific Corporation and Paychex, Inc.
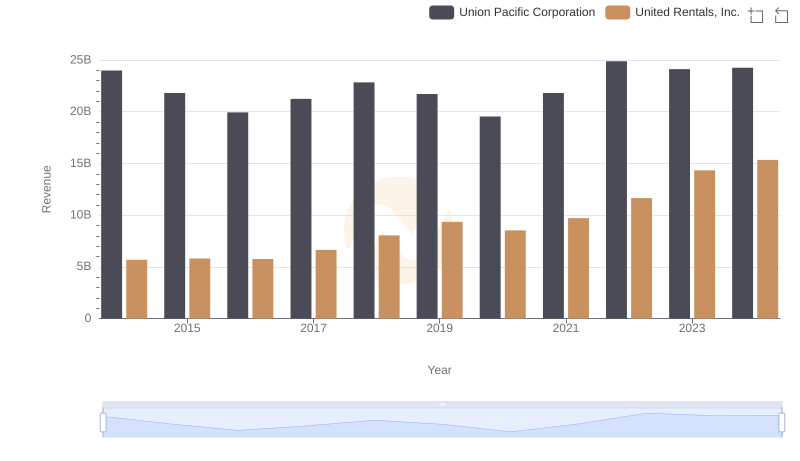
Who Generates More Revenue? Union Pacific Corporation or United Rentals, Inc.
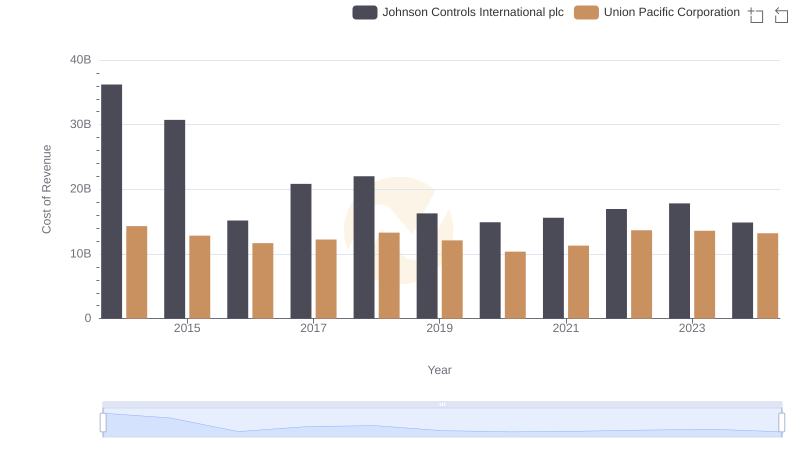
Cost of Revenue Comparison: Union Pacific Corporation vs Johnson Controls International plc
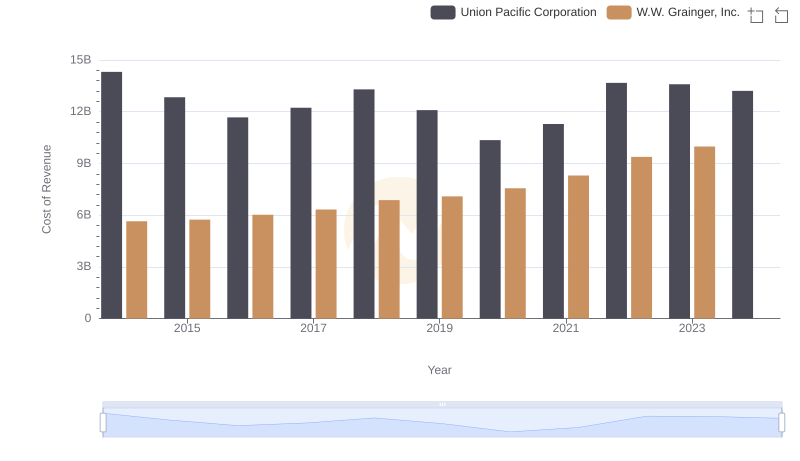
Analyzing Cost of Revenue: Union Pacific Corporation and W.W. Grainger, Inc.
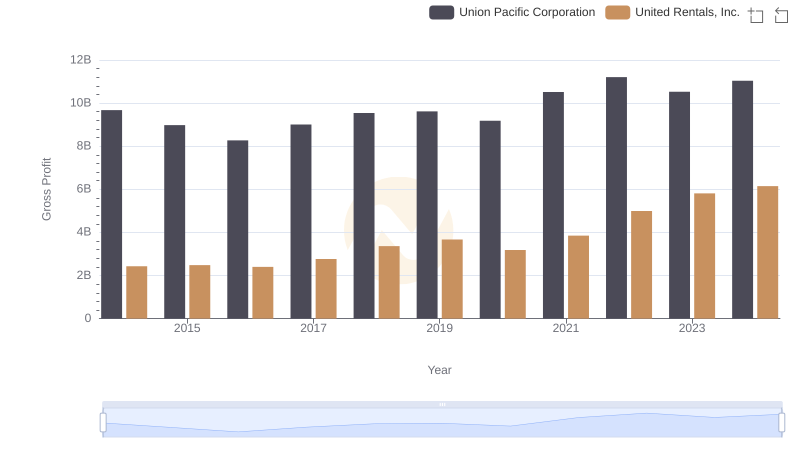
Union Pacific Corporation and United Rentals, Inc.: A Detailed Gross Profit Analysis
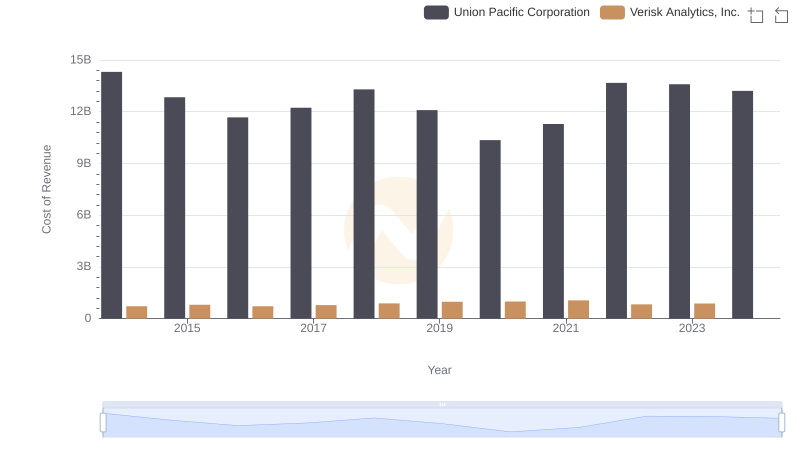
Cost of Revenue Trends: Union Pacific Corporation vs Verisk Analytics, Inc.