| __timestamp | Union Pacific Corporation | United Rentals, Inc. |
|---|---|---|
| Wednesday, January 1, 2014 | 9677000000 | 2432000000 |
| Thursday, January 1, 2015 | 8976000000 | 2480000000 |
| Friday, January 1, 2016 | 8269000000 | 2403000000 |
| Sunday, January 1, 2017 | 9009000000 | 2769000000 |
| Monday, January 1, 2018 | 9539000000 | 3364000000 |
| Tuesday, January 1, 2019 | 9614000000 | 3670000000 |
| Wednesday, January 1, 2020 | 9179000000 | 3183000000 |
| Friday, January 1, 2021 | 10514000000 | 3853000000 |
| Saturday, January 1, 2022 | 11205000000 | 4996000000 |
| Sunday, January 1, 2023 | 10529000000 | 5813000000 |
| Monday, January 1, 2024 | 11039000000 | 6150000000 |
Cracking the code
In the ever-evolving landscape of American industry, Union Pacific Corporation and United Rentals, Inc. have emerged as titans of their respective sectors. Over the past decade, from 2014 to 2024, these companies have demonstrated remarkable growth in gross profit, reflecting their strategic prowess and market adaptability.
Union Pacific, a stalwart in the railroad industry, has seen its gross profit soar by approximately 14% from 2014 to 2024. Notably, the year 2022 marked a peak, with a gross profit increase of nearly 20% compared to 2016, showcasing its resilience amidst economic fluctuations.
Meanwhile, United Rentals, a leader in equipment rental, has experienced an impressive 153% surge in gross profit over the same period. This growth trajectory underscores the company's ability to capitalize on the increasing demand for rental solutions in a dynamic market.
As we look to the future, these trends highlight the enduring strength and potential of these industry giants.
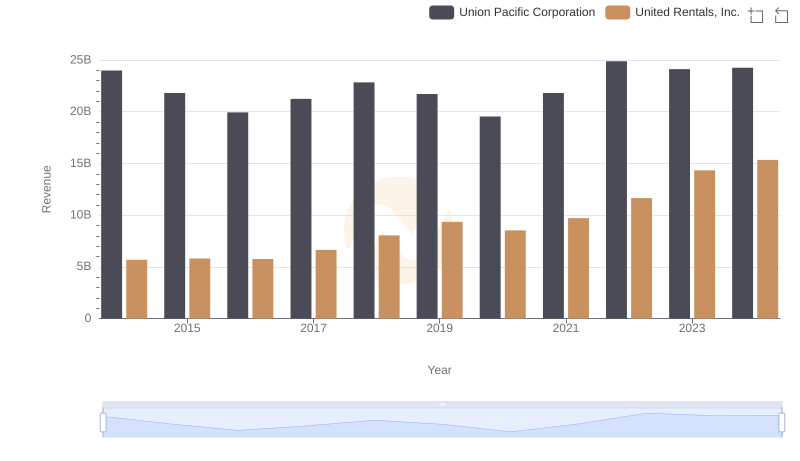
Who Generates More Revenue? Union Pacific Corporation or United Rentals, Inc.
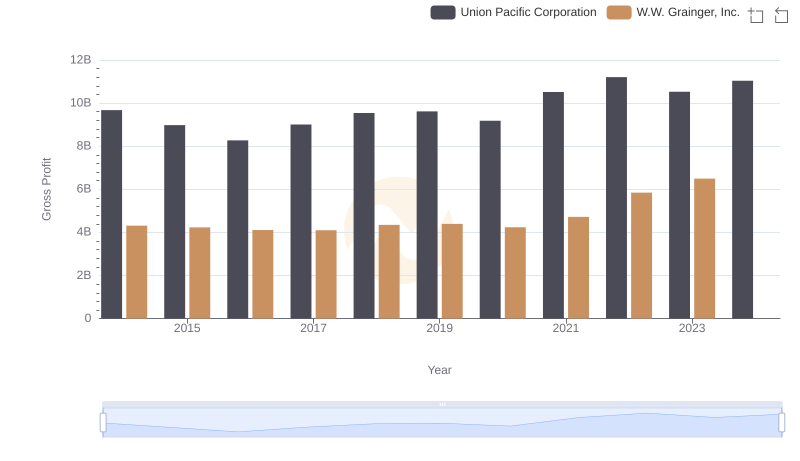
Union Pacific Corporation and W.W. Grainger, Inc.: A Detailed Gross Profit Analysis
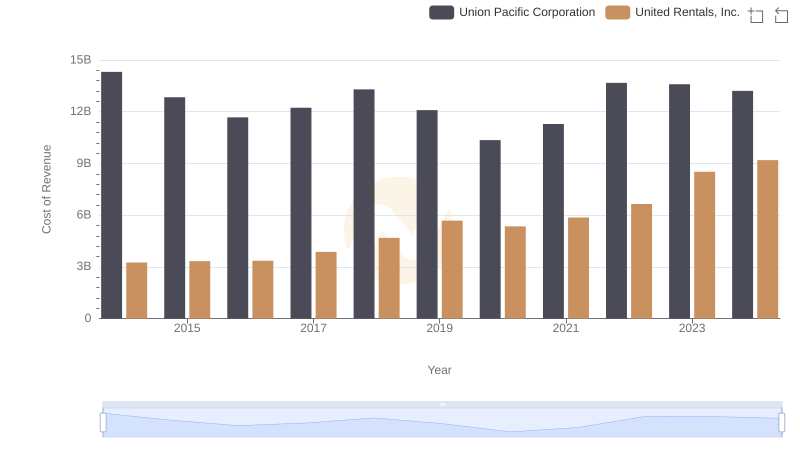
Cost of Revenue Comparison: Union Pacific Corporation vs United Rentals, Inc.
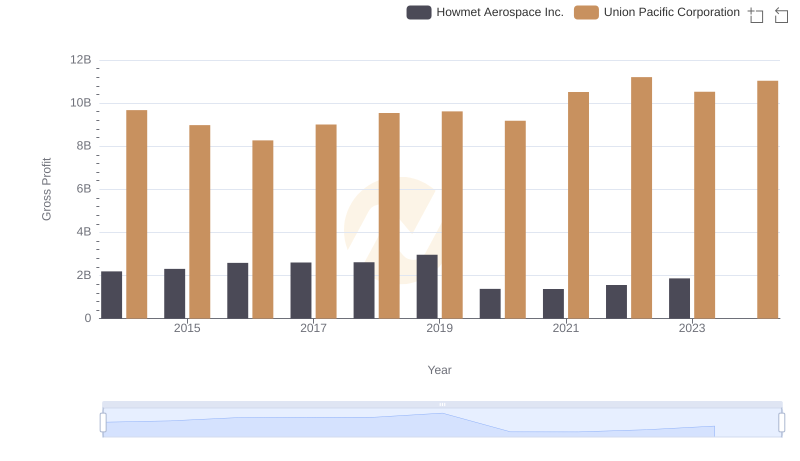
Key Insights on Gross Profit: Union Pacific Corporation vs Howmet Aerospace Inc.
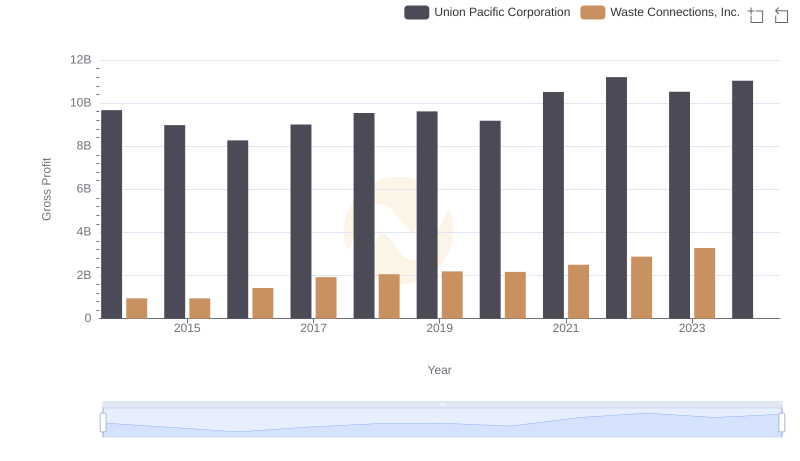
Gross Profit Analysis: Comparing Union Pacific Corporation and Waste Connections, Inc.
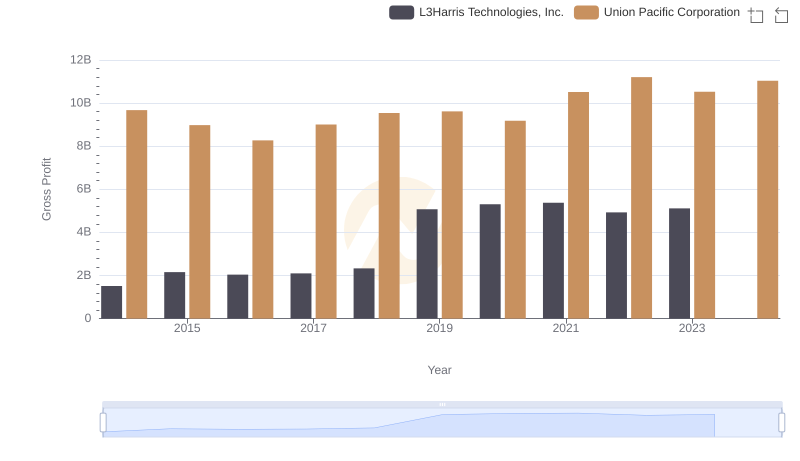
Key Insights on Gross Profit: Union Pacific Corporation vs L3Harris Technologies, Inc.