| __timestamp | American Airlines Group Inc. | Westinghouse Air Brake Technologies Corporation |
|---|---|---|
| Wednesday, January 1, 2014 | 31939000000 | 2130920000 |
| Thursday, January 1, 2015 | 27967000000 | 2281845000 |
| Friday, January 1, 2016 | 28339000000 | 2029647000 |
| Sunday, January 1, 2017 | 31154000000 | 2841159000 |
| Monday, January 1, 2018 | 34490000000 | 3151816000 |
| Tuesday, January 1, 2019 | 35379000000 | 6122400000 |
| Wednesday, January 1, 2020 | 24933000000 | 5657400000 |
| Friday, January 1, 2021 | 29855000000 | 5687000000 |
| Saturday, January 1, 2022 | 39934000000 | 6070000000 |
| Sunday, January 1, 2023 | 40978000000 | 6733000000 |
| Monday, January 1, 2024 | 7021000000 |
Unveiling the hidden dimensions of data
In the ever-evolving landscape of corporate efficiency, the cost of revenue is a critical metric. From 2014 to 2023, American Airlines Group Inc. and Westinghouse Air Brake Technologies Corporation have showcased contrasting approaches. American Airlines, with a mean cost of revenue of approximately $32.5 billion, saw a 28% increase over the decade, peaking in 2023. Meanwhile, Westinghouse Air Brake, with a mean of $4.3 billion, experienced a 216% surge, reflecting a strategic focus on cost management.
The data reveals that while American Airlines faced fluctuations, Westinghouse Air Brake maintained a steady upward trajectory, particularly notable in 2019 and 2023. This comparison highlights the diverse strategies in managing operational costs, offering insights into industry-specific challenges and efficiencies. As businesses navigate economic uncertainties, understanding these trends becomes crucial for stakeholders aiming to optimize financial performance.
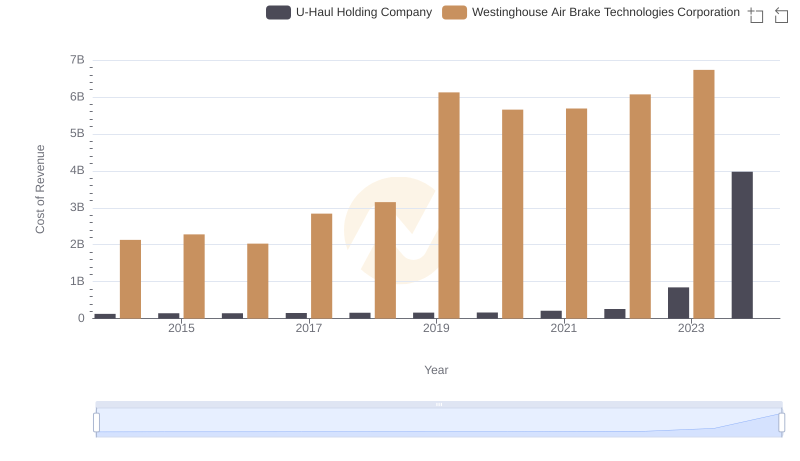
Cost Insights: Breaking Down Westinghouse Air Brake Technologies Corporation and U-Haul Holding Company's Expenses
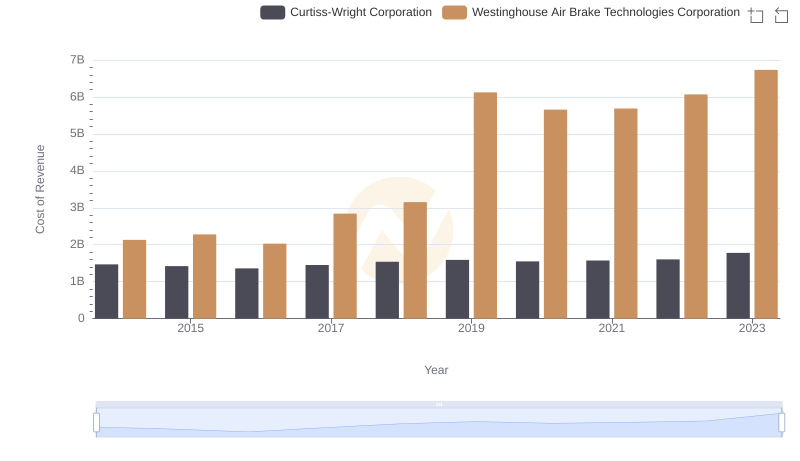
Westinghouse Air Brake Technologies Corporation vs Curtiss-Wright Corporation: Efficiency in Cost of Revenue Explored
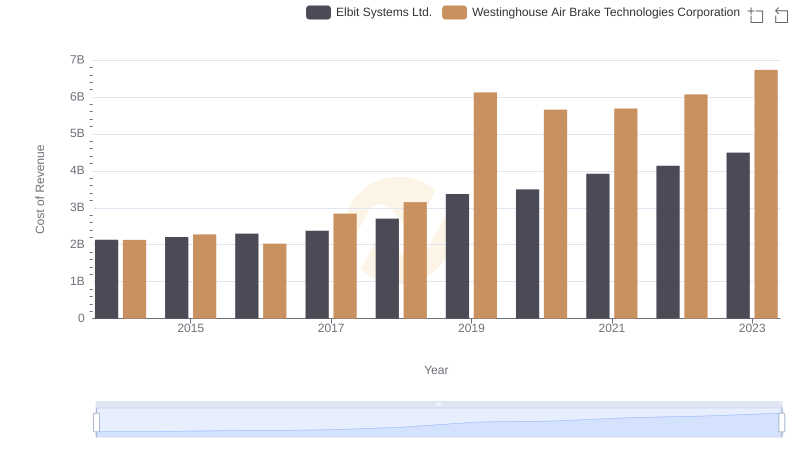
Cost of Revenue Trends: Westinghouse Air Brake Technologies Corporation vs Elbit Systems Ltd.
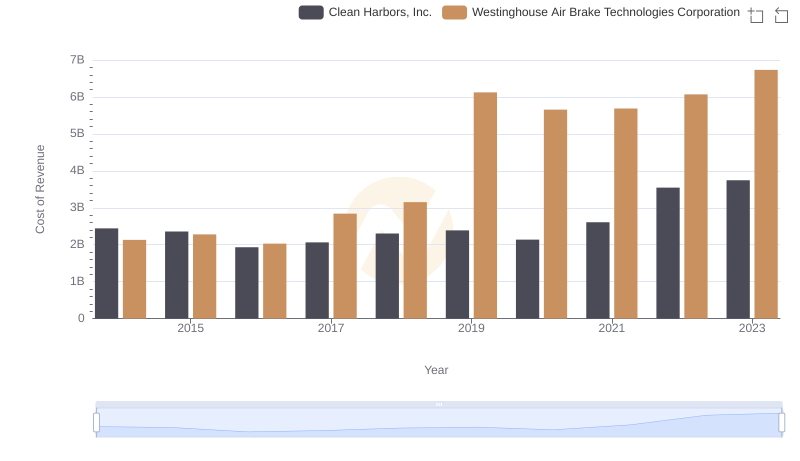
Comparing Cost of Revenue Efficiency: Westinghouse Air Brake Technologies Corporation vs Clean Harbors, Inc.
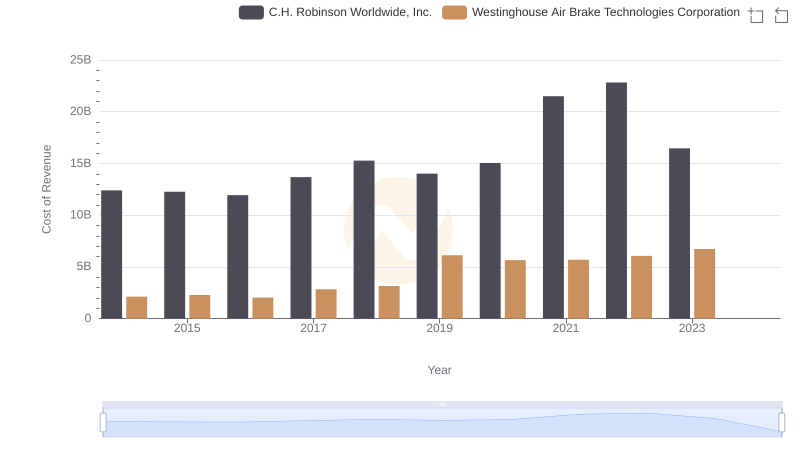
Cost of Revenue: Key Insights for Westinghouse Air Brake Technologies Corporation and C.H. Robinson Worldwide, Inc.
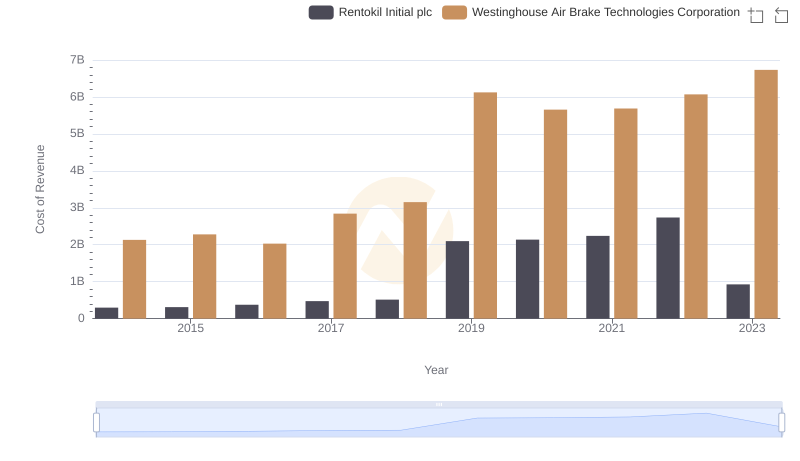
Comparing Cost of Revenue Efficiency: Westinghouse Air Brake Technologies Corporation vs Rentokil Initial plc
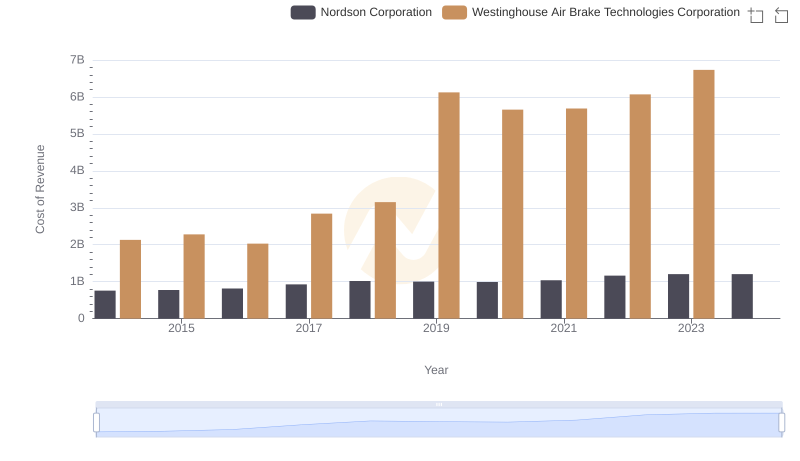
Cost Insights: Breaking Down Westinghouse Air Brake Technologies Corporation and Nordson Corporation's Expenses
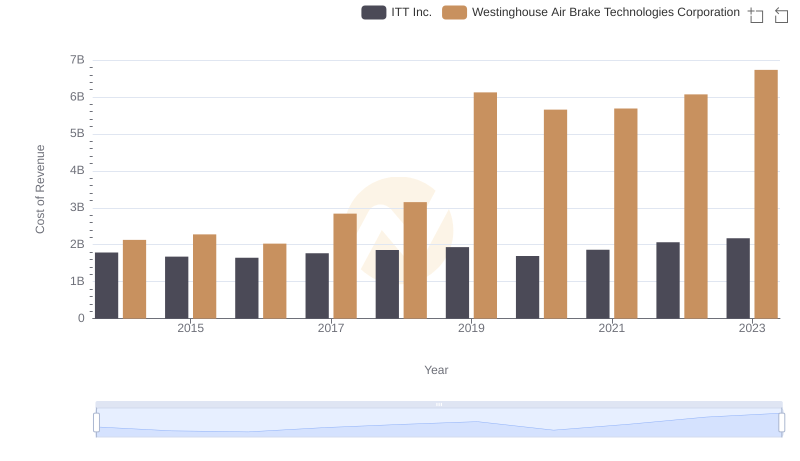
Cost of Revenue: Key Insights for Westinghouse Air Brake Technologies Corporation and ITT Inc.
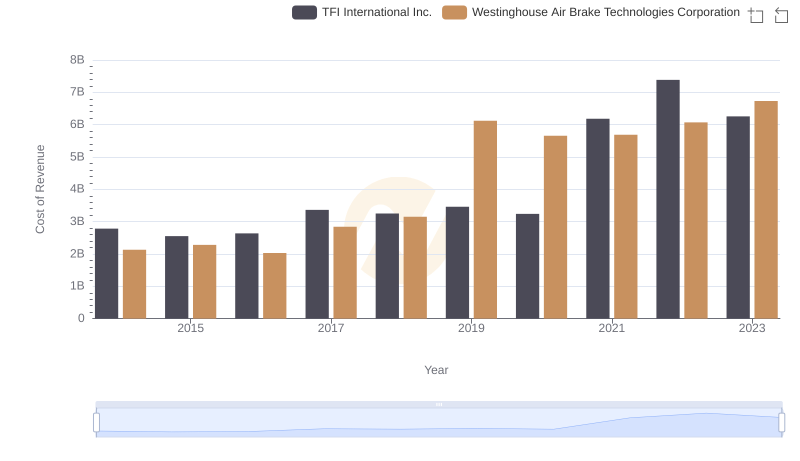
Cost of Revenue Trends: Westinghouse Air Brake Technologies Corporation vs TFI International Inc.
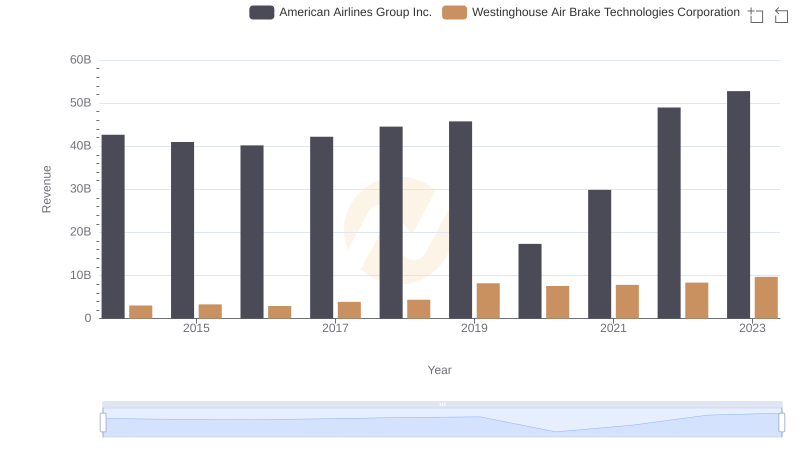
Westinghouse Air Brake Technologies Corporation vs American Airlines Group Inc.: Annual Revenue Growth Compared
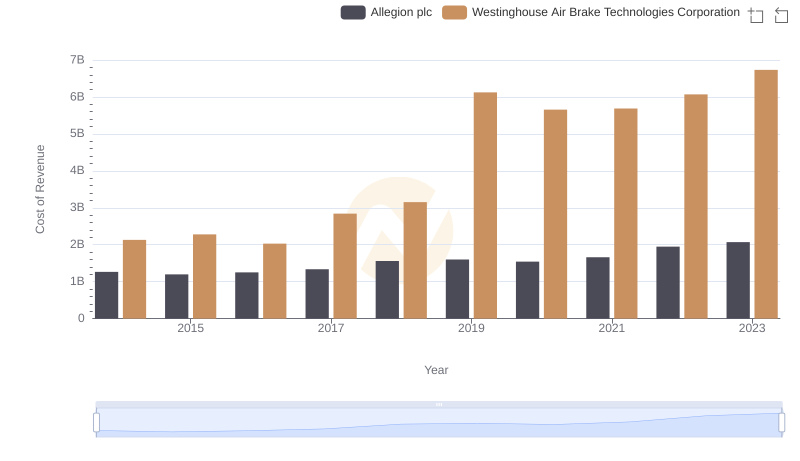
Comparing Cost of Revenue Efficiency: Westinghouse Air Brake Technologies Corporation vs Allegion plc
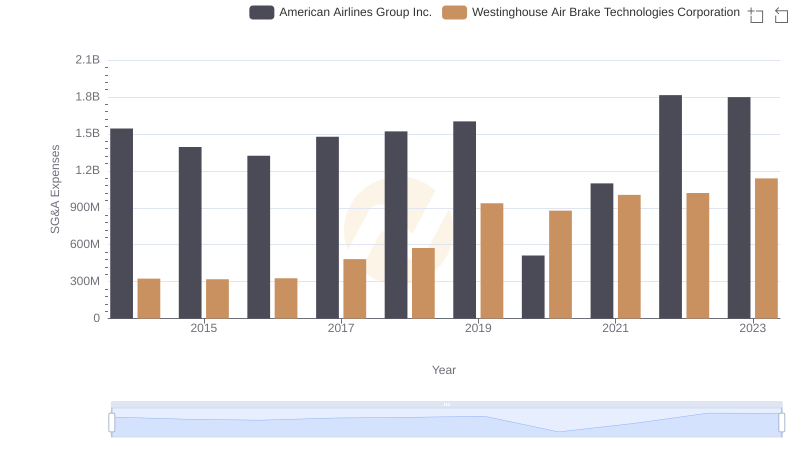
Cost Management Insights: SG&A Expenses for Westinghouse Air Brake Technologies Corporation and American Airlines Group Inc.