| __timestamp | Nordson Corporation | Westinghouse Air Brake Technologies Corporation |
|---|---|---|
| Wednesday, January 1, 2014 | 758923000 | 2130920000 |
| Thursday, January 1, 2015 | 774702000 | 2281845000 |
| Friday, January 1, 2016 | 815495000 | 2029647000 |
| Sunday, January 1, 2017 | 927981000 | 2841159000 |
| Monday, January 1, 2018 | 1018703000 | 3151816000 |
| Tuesday, January 1, 2019 | 1002123000 | 6122400000 |
| Wednesday, January 1, 2020 | 990632000 | 5657400000 |
| Friday, January 1, 2021 | 1038129000 | 5687000000 |
| Saturday, January 1, 2022 | 1163742000 | 6070000000 |
| Sunday, January 1, 2023 | 1203227000 | 6733000000 |
| Monday, January 1, 2024 | 1203792000 | 7021000000 |
Unlocking the unknown
In the ever-evolving landscape of industrial giants, understanding cost structures is pivotal. Westinghouse Air Brake Technologies Corporation and Nordson Corporation, two stalwarts in their respective fields, offer intriguing insights into their financial strategies over the past decade. From 2014 to 2023, Westinghouse's cost of revenue surged by approximately 216%, peaking in 2023. This reflects their aggressive expansion and investment in technology. In contrast, Nordson Corporation exhibited a steady growth of around 58% in the same period, highlighting their consistent operational efficiency.
Interestingly, 2024 data for Westinghouse is missing, leaving room for speculation on their future trajectory. This comparative analysis not only underscores the dynamic nature of industrial expenses but also provides a window into the strategic priorities of these corporations. As we delve deeper into these numbers, the narrative of industrial evolution becomes clearer, offering valuable lessons for investors and industry enthusiasts alike.
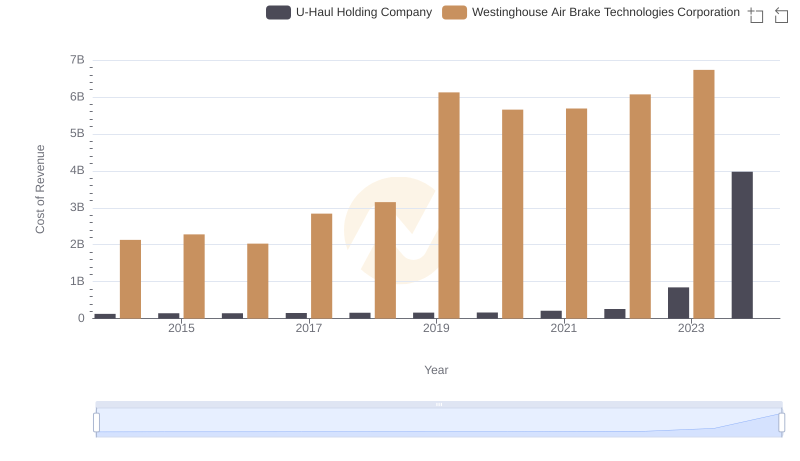
Cost Insights: Breaking Down Westinghouse Air Brake Technologies Corporation and U-Haul Holding Company's Expenses
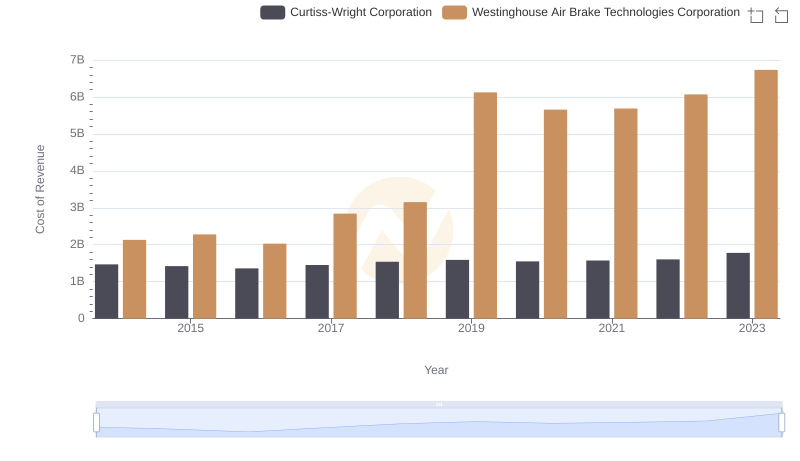
Westinghouse Air Brake Technologies Corporation vs Curtiss-Wright Corporation: Efficiency in Cost of Revenue Explored
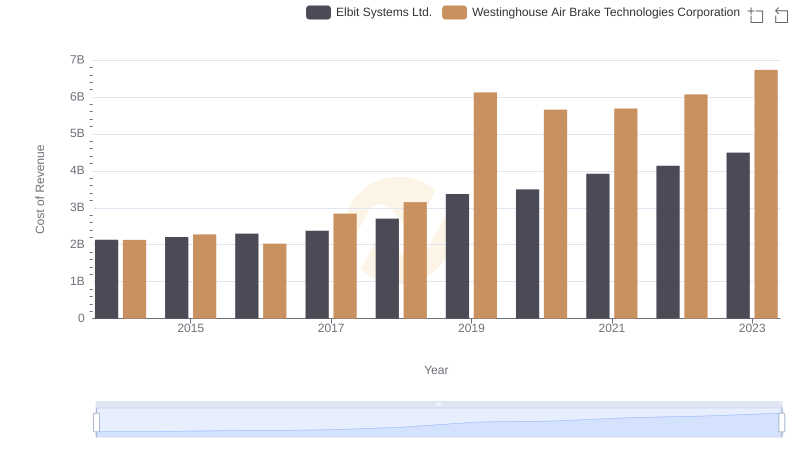
Cost of Revenue Trends: Westinghouse Air Brake Technologies Corporation vs Elbit Systems Ltd.
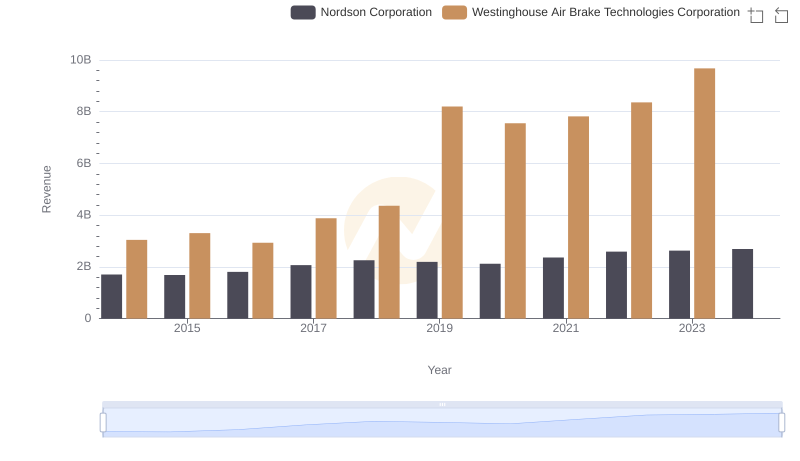
Annual Revenue Comparison: Westinghouse Air Brake Technologies Corporation vs Nordson Corporation
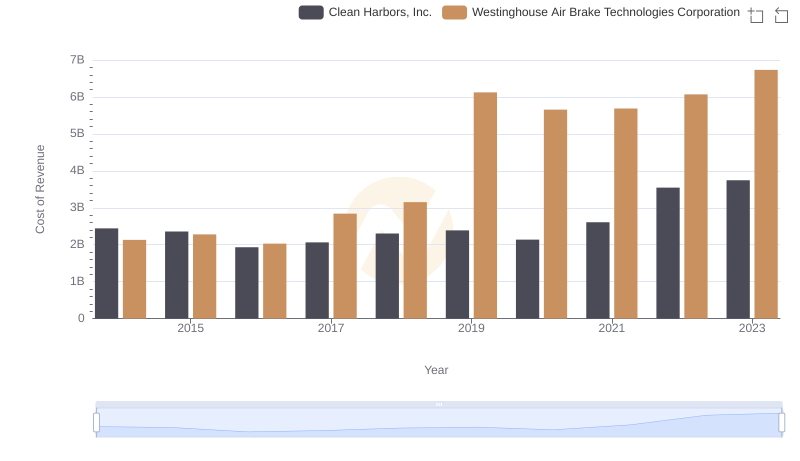
Comparing Cost of Revenue Efficiency: Westinghouse Air Brake Technologies Corporation vs Clean Harbors, Inc.
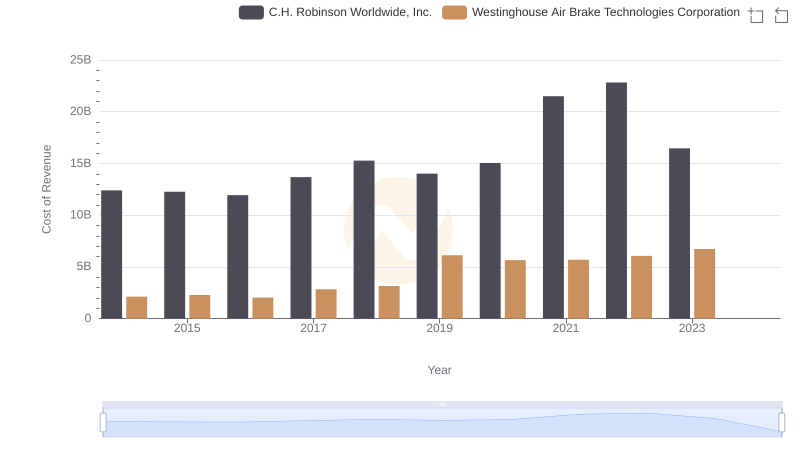
Cost of Revenue: Key Insights for Westinghouse Air Brake Technologies Corporation and C.H. Robinson Worldwide, Inc.
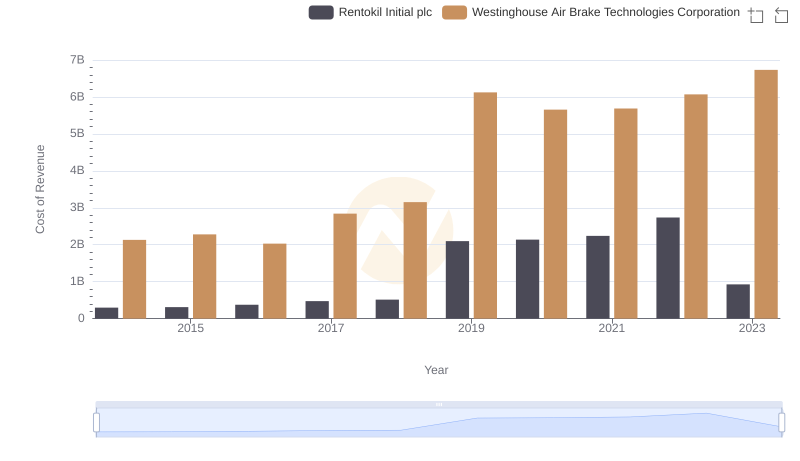
Comparing Cost of Revenue Efficiency: Westinghouse Air Brake Technologies Corporation vs Rentokil Initial plc
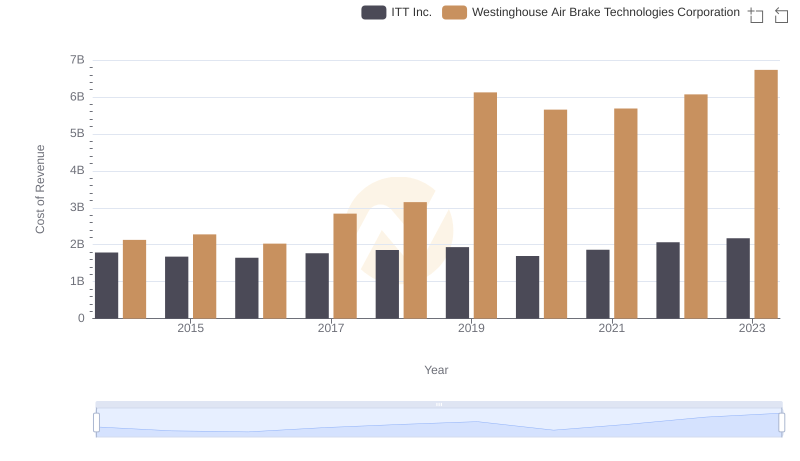
Cost of Revenue: Key Insights for Westinghouse Air Brake Technologies Corporation and ITT Inc.
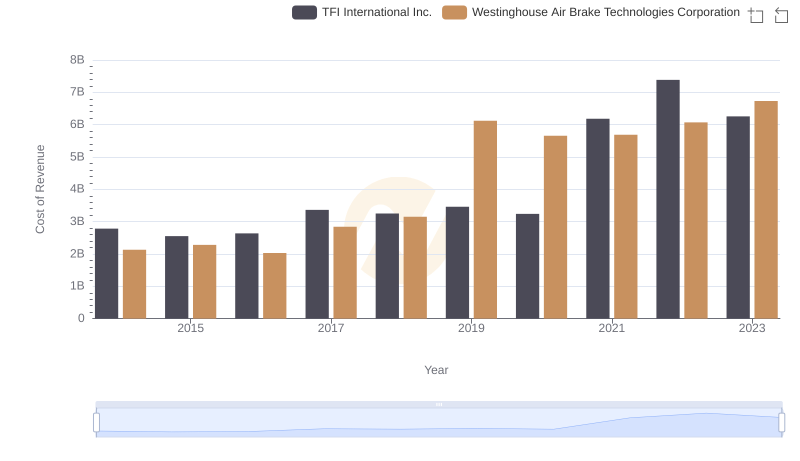
Cost of Revenue Trends: Westinghouse Air Brake Technologies Corporation vs TFI International Inc.
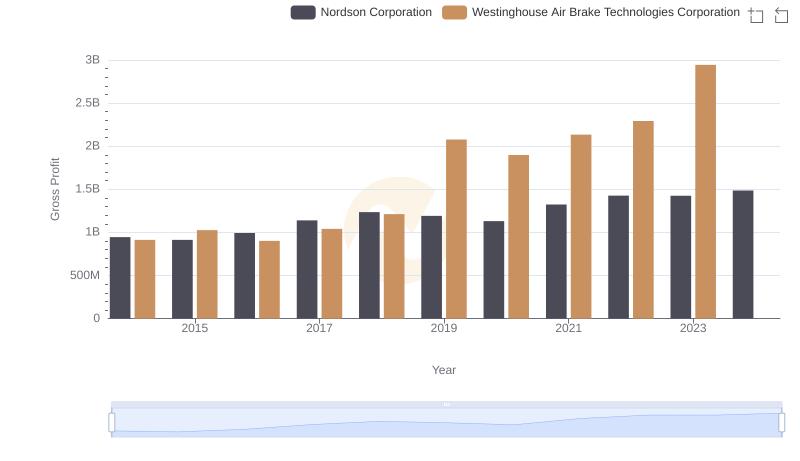
Westinghouse Air Brake Technologies Corporation vs Nordson Corporation: A Gross Profit Performance Breakdown
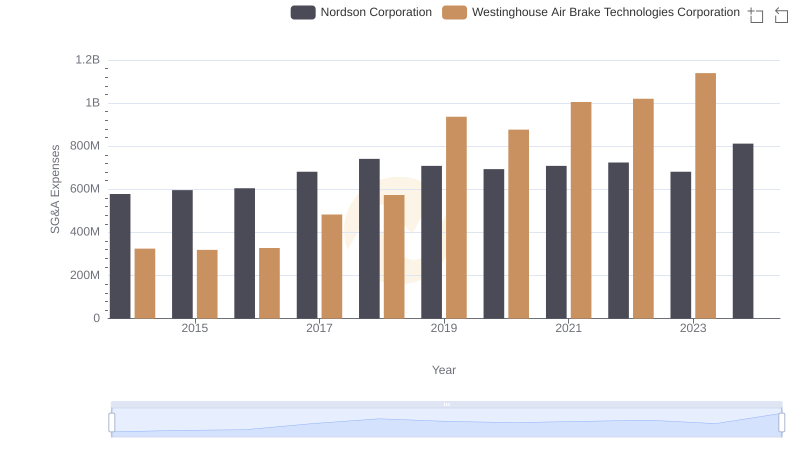
SG&A Efficiency Analysis: Comparing Westinghouse Air Brake Technologies Corporation and Nordson Corporation