| __timestamp | Elbit Systems Ltd. | Westinghouse Air Brake Technologies Corporation |
|---|---|---|
| Wednesday, January 1, 2014 | 2133151000 | 2130920000 |
| Thursday, January 1, 2015 | 2210528000 | 2281845000 |
| Friday, January 1, 2016 | 2300636000 | 2029647000 |
| Sunday, January 1, 2017 | 2379905000 | 2841159000 |
| Monday, January 1, 2018 | 2707505000 | 3151816000 |
| Tuesday, January 1, 2019 | 3371933000 | 6122400000 |
| Wednesday, January 1, 2020 | 3497465000 | 5657400000 |
| Friday, January 1, 2021 | 3920473000 | 5687000000 |
| Saturday, January 1, 2022 | 4138266000 | 6070000000 |
| Sunday, January 1, 2023 | 4491790000 | 6733000000 |
| Monday, January 1, 2024 | 7021000000 |
Unlocking the unknown
In the ever-evolving landscape of global industries, understanding cost dynamics is crucial. This analysis delves into the cost of revenue trends for two industry giants: Westinghouse Air Brake Technologies Corporation and Elbit Systems Ltd., from 2014 to 2023.
Westinghouse Air Brake Technologies Corporation, a leader in rail technology, has seen its cost of revenue surge by approximately 216% over the past decade, peaking in 2023. This growth reflects the company's expanding operations and increased market demand. In contrast, Elbit Systems Ltd., a prominent player in defense electronics, experienced a 110% increase in cost of revenue during the same period. This steady rise underscores its strategic investments in innovation and technology.
These trends highlight the distinct growth trajectories and strategic priorities of these corporations, offering valuable insights for investors and industry analysts alike.
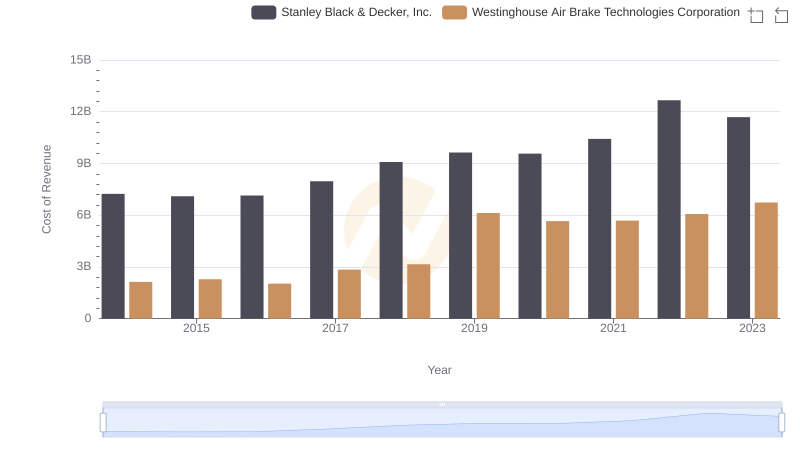
Cost of Revenue Comparison: Westinghouse Air Brake Technologies Corporation vs Stanley Black & Decker, Inc.
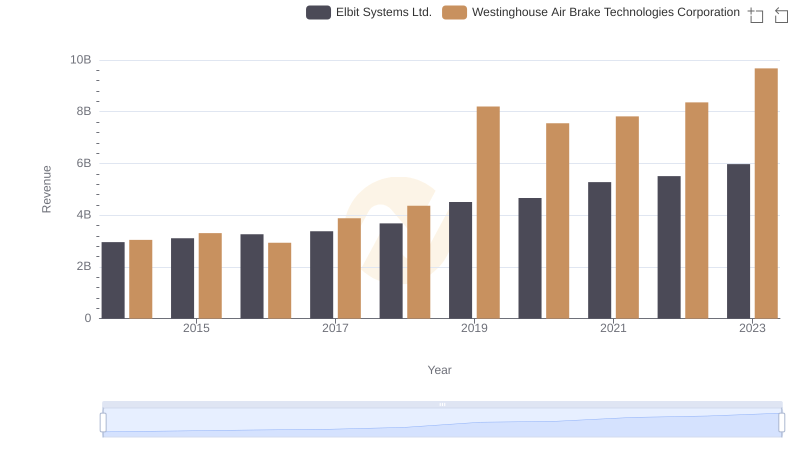
Westinghouse Air Brake Technologies Corporation and Elbit Systems Ltd.: A Comprehensive Revenue Analysis
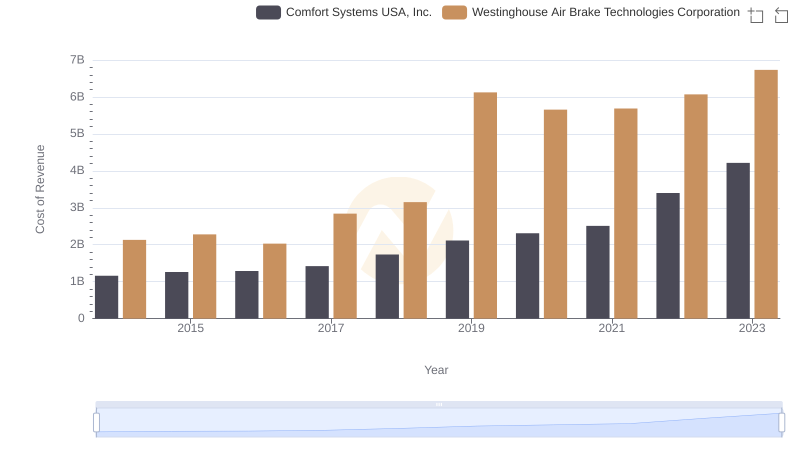
Cost of Revenue Trends: Westinghouse Air Brake Technologies Corporation vs Comfort Systems USA, Inc.
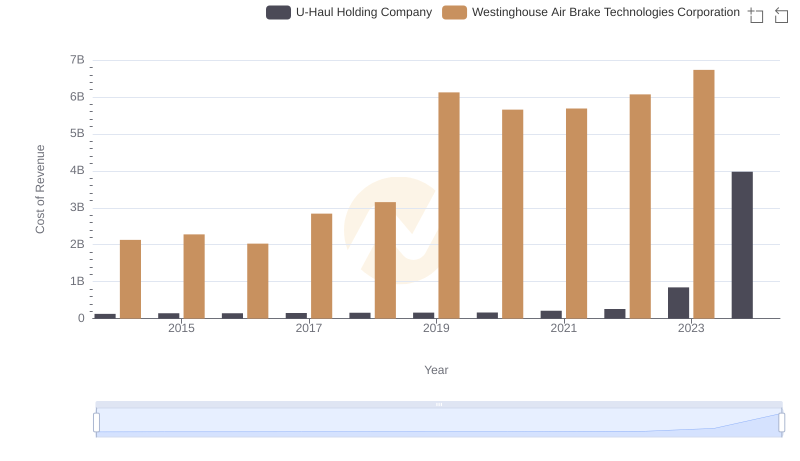
Cost Insights: Breaking Down Westinghouse Air Brake Technologies Corporation and U-Haul Holding Company's Expenses
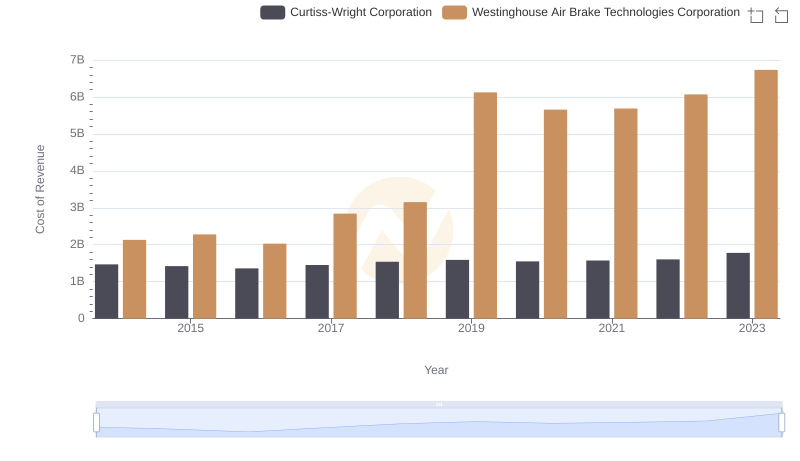
Westinghouse Air Brake Technologies Corporation vs Curtiss-Wright Corporation: Efficiency in Cost of Revenue Explored
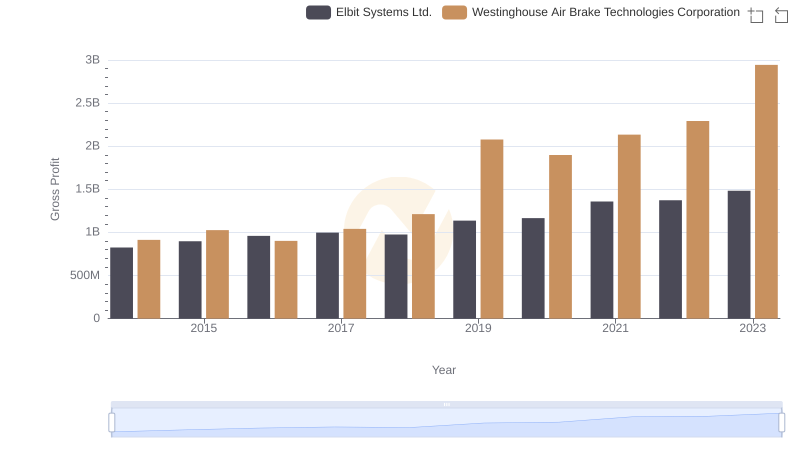
Westinghouse Air Brake Technologies Corporation and Elbit Systems Ltd.: A Detailed Gross Profit Analysis
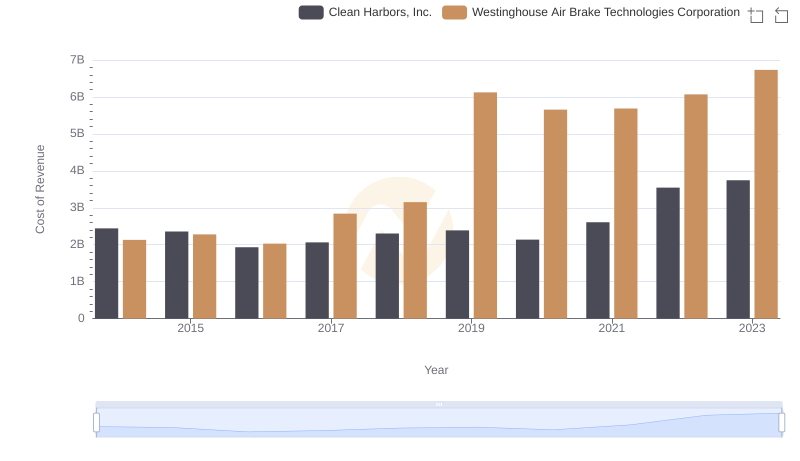
Comparing Cost of Revenue Efficiency: Westinghouse Air Brake Technologies Corporation vs Clean Harbors, Inc.
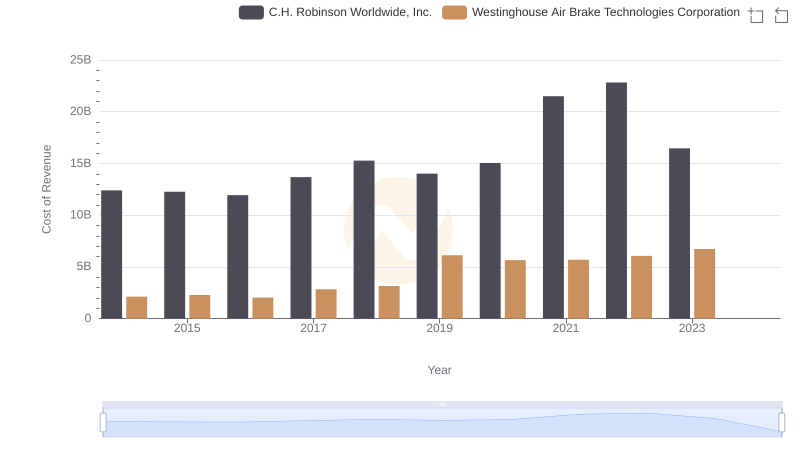
Cost of Revenue: Key Insights for Westinghouse Air Brake Technologies Corporation and C.H. Robinson Worldwide, Inc.
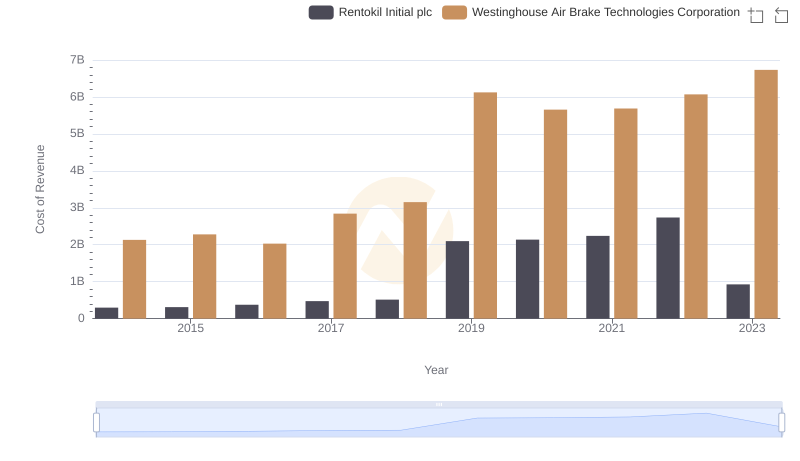
Comparing Cost of Revenue Efficiency: Westinghouse Air Brake Technologies Corporation vs Rentokil Initial plc
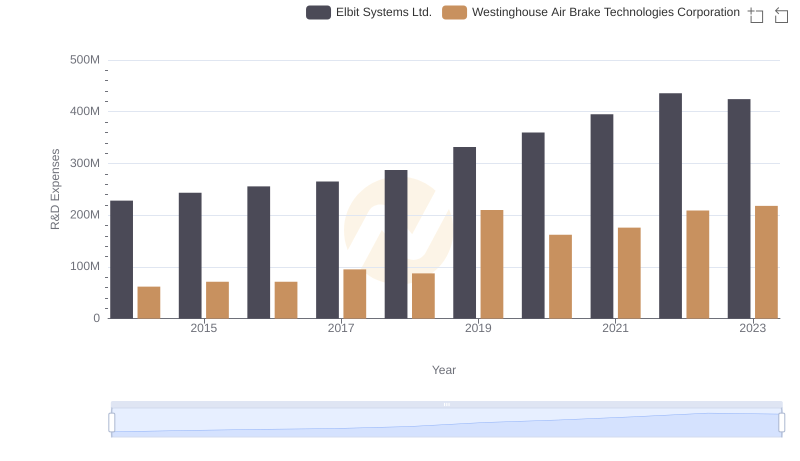
Westinghouse Air Brake Technologies Corporation vs Elbit Systems Ltd.: Strategic Focus on R&D Spending
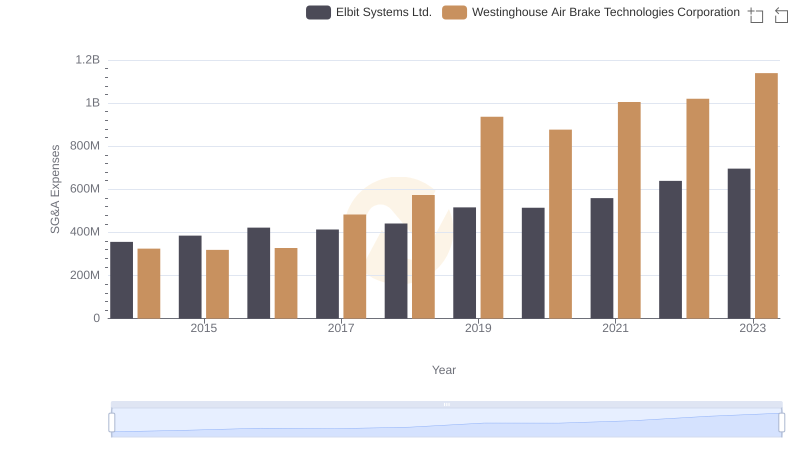
Comparing SG&A Expenses: Westinghouse Air Brake Technologies Corporation vs Elbit Systems Ltd. Trends and Insights