| __timestamp | American Airlines Group Inc. | Westinghouse Air Brake Technologies Corporation |
|---|---|---|
| Wednesday, January 1, 2014 | 42650000000 | 3044454000 |
| Thursday, January 1, 2015 | 40990000000 | 3307998000 |
| Friday, January 1, 2016 | 40180000000 | 2931188000 |
| Sunday, January 1, 2017 | 42207000000 | 3881756000 |
| Monday, January 1, 2018 | 44541000000 | 4363547000 |
| Tuesday, January 1, 2019 | 45768000000 | 8200000000 |
| Wednesday, January 1, 2020 | 17337000000 | 7556100000 |
| Friday, January 1, 2021 | 29882000000 | 7822000000 |
| Saturday, January 1, 2022 | 48971000000 | 8362000000 |
| Sunday, January 1, 2023 | 52788000000 | 9677000000 |
| Monday, January 1, 2024 | 10387000000 |
Unveiling the hidden dimensions of data
In the ever-evolving landscape of American industry, the revenue trajectories of American Airlines Group Inc. and Westinghouse Air Brake Technologies Corporation offer a fascinating glimpse into the resilience and adaptability of two distinct sectors. From 2014 to 2023, American Airlines experienced a rollercoaster of revenue changes, with a notable dip in 2020, plummeting by nearly 60% due to the global pandemic. However, the airline rebounded impressively, achieving a 204% increase by 2023. Meanwhile, Westinghouse Air Brake Technologies steadily climbed, with a 218% growth over the same period, reflecting the consistent demand for rail technology. This comparison underscores the dynamic nature of these industries, highlighting the airline's vulnerability to global events and the railroad's steady ascent. As we look to the future, these trends may offer insights into the broader economic shifts and consumer preferences shaping the American market.
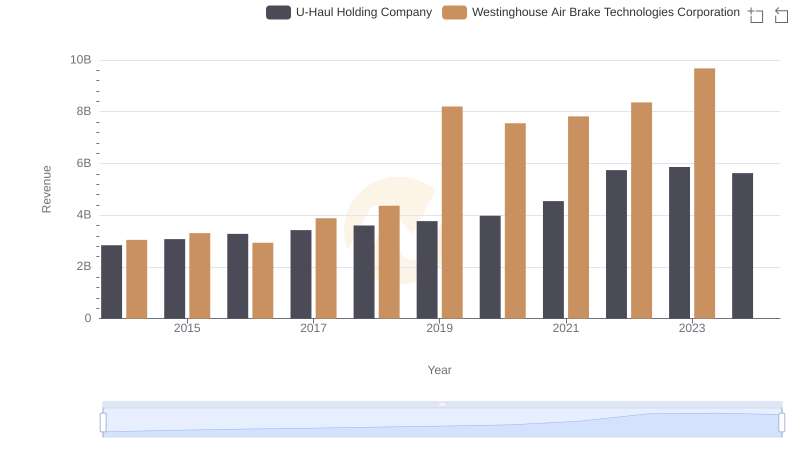
Westinghouse Air Brake Technologies Corporation vs U-Haul Holding Company: Annual Revenue Growth Compared
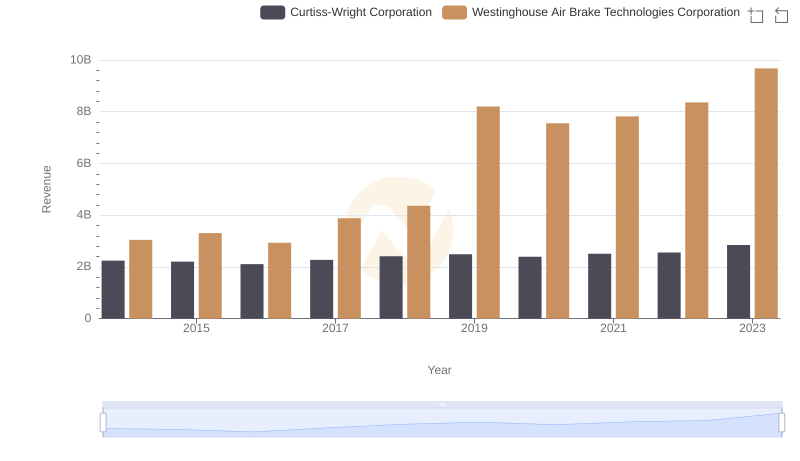
Who Generates More Revenue? Westinghouse Air Brake Technologies Corporation or Curtiss-Wright Corporation
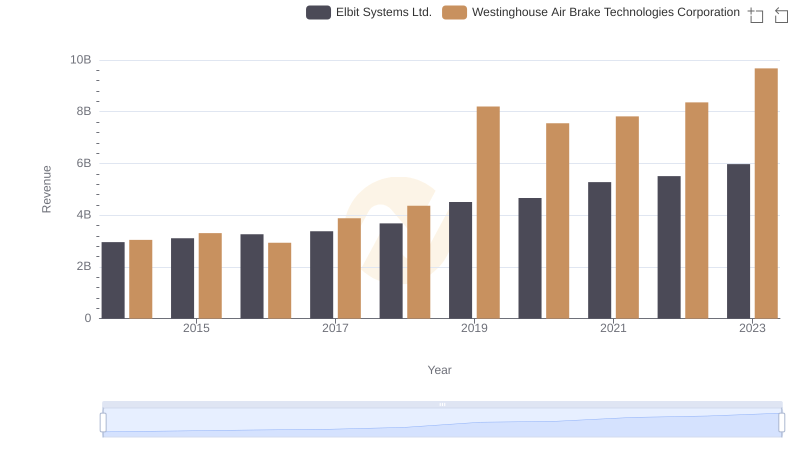
Westinghouse Air Brake Technologies Corporation and Elbit Systems Ltd.: A Comprehensive Revenue Analysis
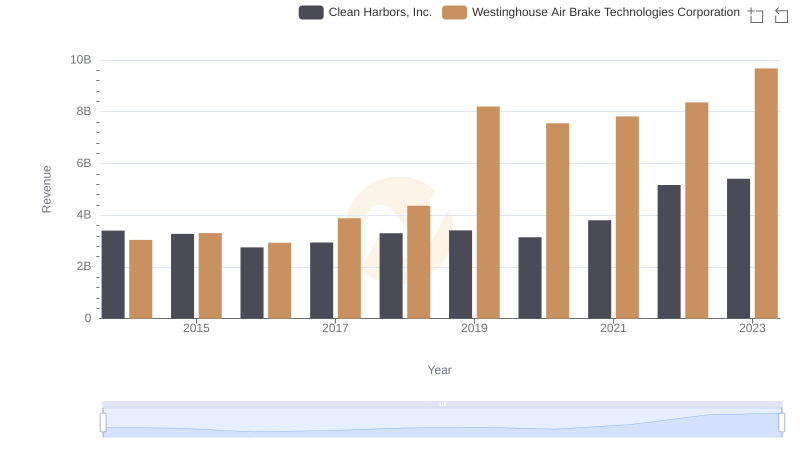
Annual Revenue Comparison: Westinghouse Air Brake Technologies Corporation vs Clean Harbors, Inc.
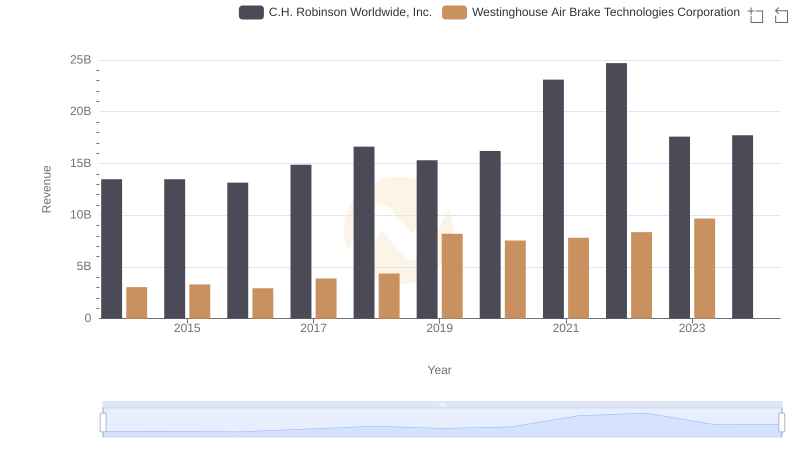
Breaking Down Revenue Trends: Westinghouse Air Brake Technologies Corporation vs C.H. Robinson Worldwide, Inc.
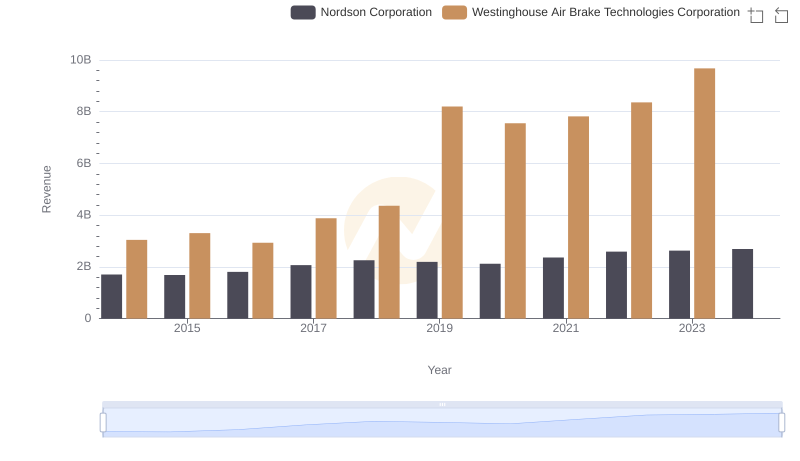
Annual Revenue Comparison: Westinghouse Air Brake Technologies Corporation vs Nordson Corporation
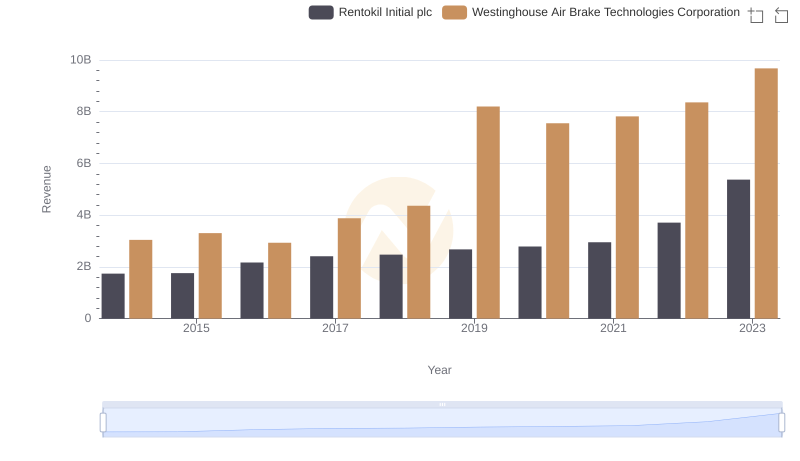
Revenue Insights: Westinghouse Air Brake Technologies Corporation and Rentokil Initial plc Performance Compared
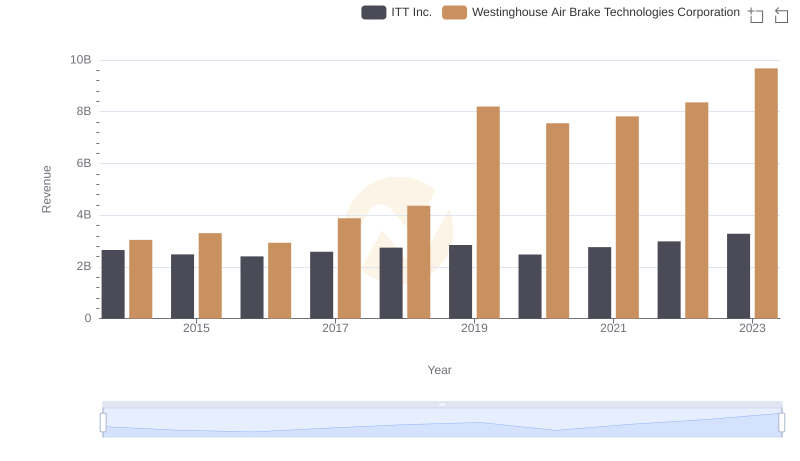
Westinghouse Air Brake Technologies Corporation vs ITT Inc.: Annual Revenue Growth Compared
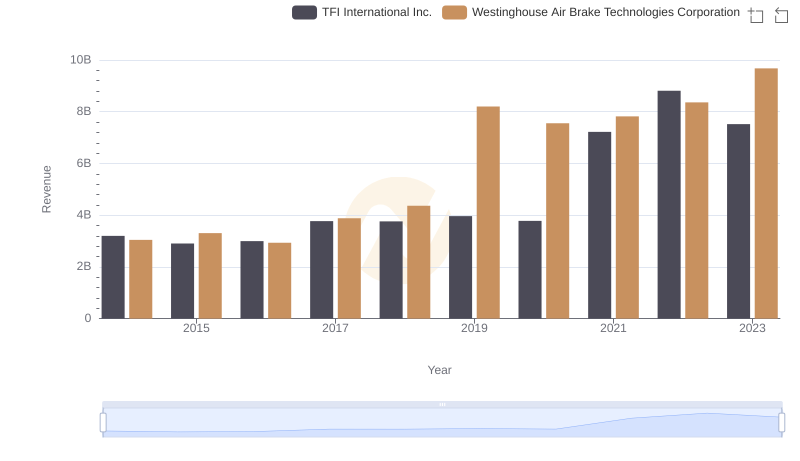
Westinghouse Air Brake Technologies Corporation or TFI International Inc.: Who Leads in Yearly Revenue?
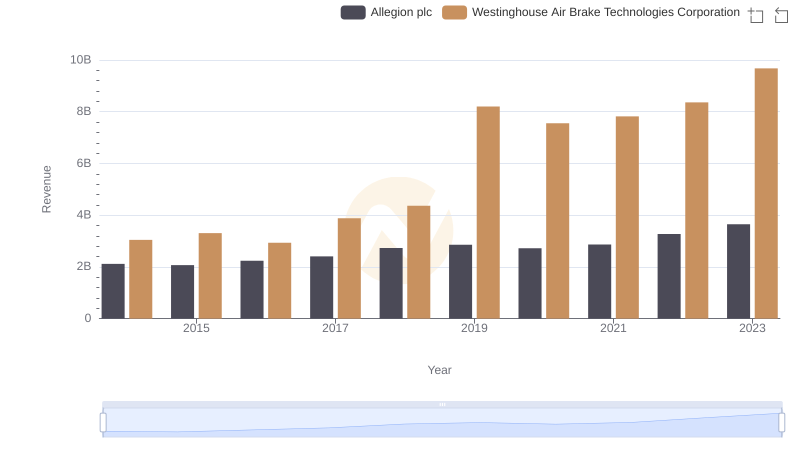
Annual Revenue Comparison: Westinghouse Air Brake Technologies Corporation vs Allegion plc
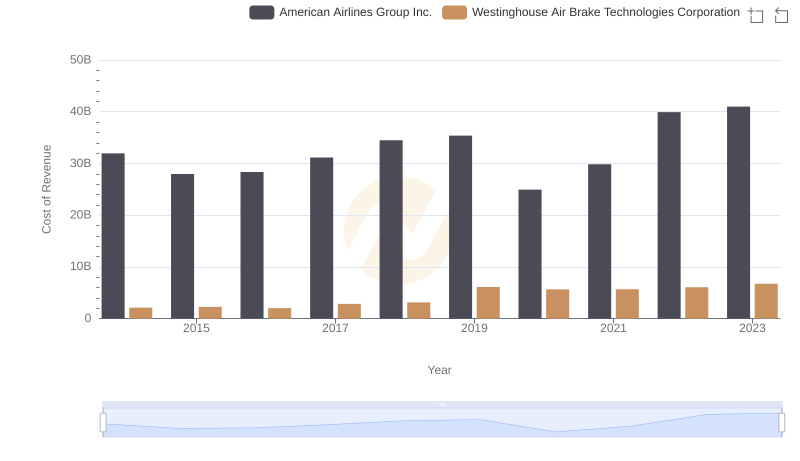
Westinghouse Air Brake Technologies Corporation vs American Airlines Group Inc.: Efficiency in Cost of Revenue Explored
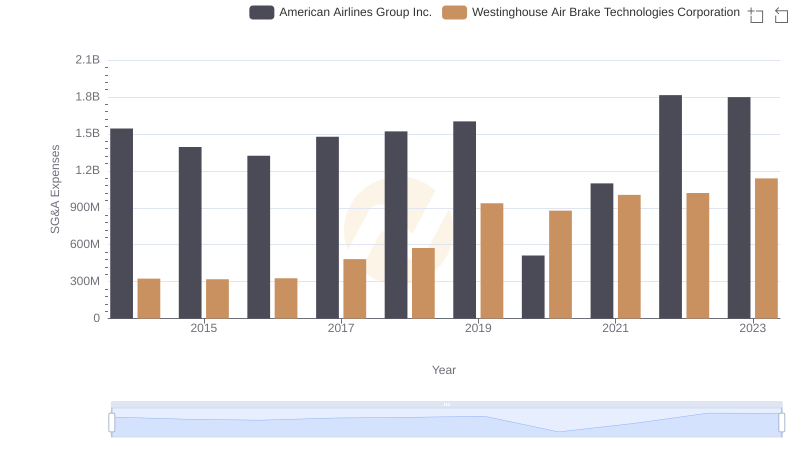
Cost Management Insights: SG&A Expenses for Westinghouse Air Brake Technologies Corporation and American Airlines Group Inc.