| __timestamp | ITT Inc. | Westinghouse Air Brake Technologies Corporation |
|---|---|---|
| Wednesday, January 1, 2014 | 1788200000 | 2130920000 |
| Thursday, January 1, 2015 | 1676500000 | 2281845000 |
| Friday, January 1, 2016 | 1647200000 | 2029647000 |
| Sunday, January 1, 2017 | 1768100000 | 2841159000 |
| Monday, January 1, 2018 | 1857900000 | 3151816000 |
| Tuesday, January 1, 2019 | 1936300000 | 6122400000 |
| Wednesday, January 1, 2020 | 1695600000 | 5657400000 |
| Friday, January 1, 2021 | 1865500000 | 5687000000 |
| Saturday, January 1, 2022 | 2065400000 | 6070000000 |
| Sunday, January 1, 2023 | 2175700000 | 6733000000 |
| Monday, January 1, 2024 | 2383400000 | 7021000000 |
Igniting the spark of knowledge
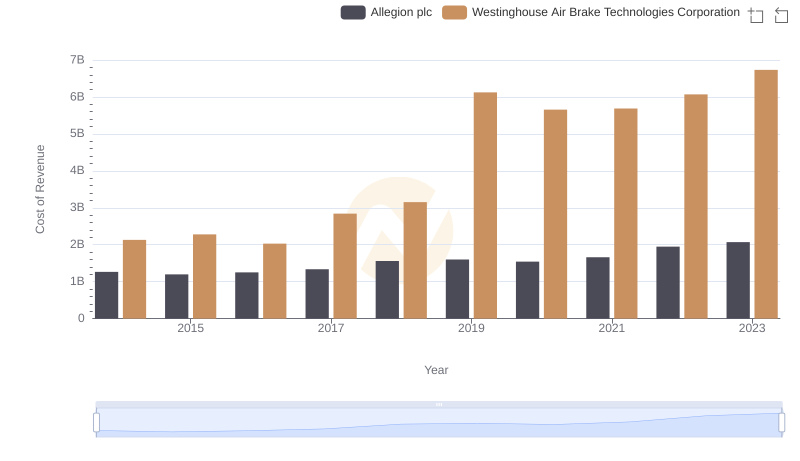
In the ever-evolving landscape of industrial manufacturing, understanding cost structures is crucial. Over the past decade, Westinghouse Air Brake Technologies Corporation and ITT Inc. have shown distinct trends in their cost of revenue. From 2014 to 2023, Westinghouse's cost of revenue surged by approximately 216%, peaking in 2023. This reflects their aggressive expansion and increased production capabilities. In contrast, ITT Inc. experienced a more modest growth of around 22% over the same period, indicating a stable yet cautious approach to scaling operations.
The year 2019 marked a significant leap for Westinghouse, with a 94% increase from the previous year, likely due to strategic acquisitions and market expansion. Meanwhile, ITT Inc. maintained a steady trajectory, with its highest cost of revenue recorded in 2023. These insights highlight the contrasting strategies of these industrial giants, offering valuable lessons in cost management and growth strategies.
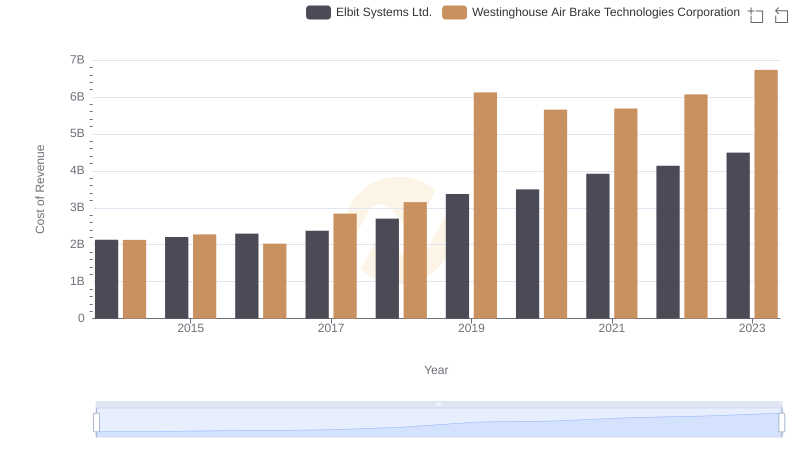
Cost of Revenue Trends: Westinghouse Air Brake Technologies Corporation vs Elbit Systems Ltd.
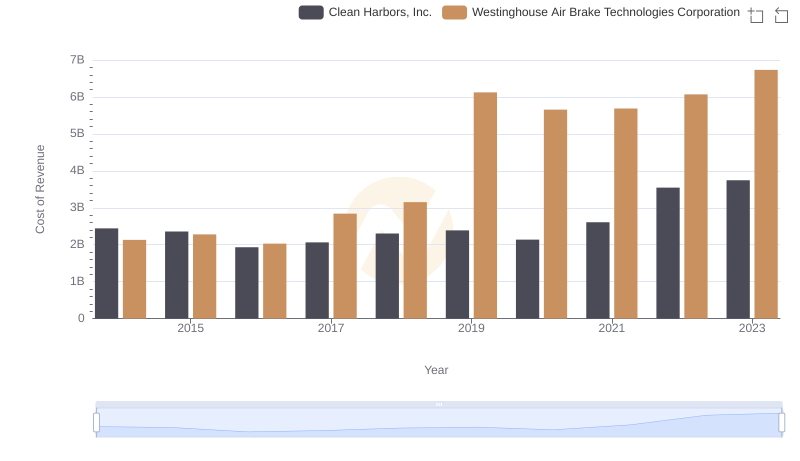
Comparing Cost of Revenue Efficiency: Westinghouse Air Brake Technologies Corporation vs Clean Harbors, Inc.
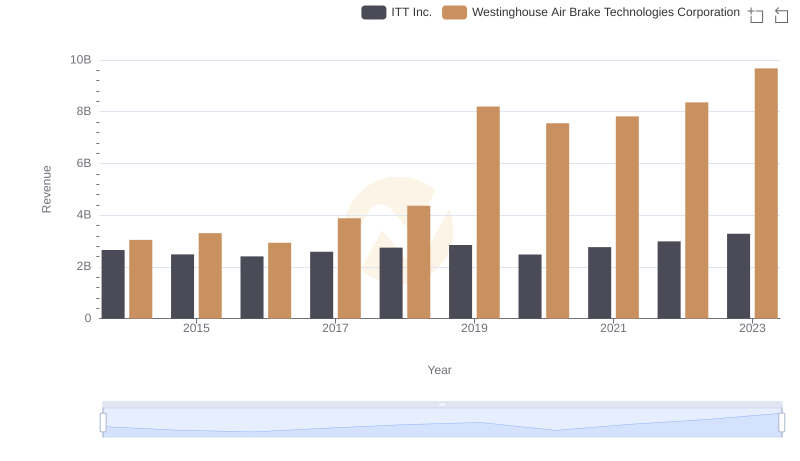
Westinghouse Air Brake Technologies Corporation vs ITT Inc.: Annual Revenue Growth Compared
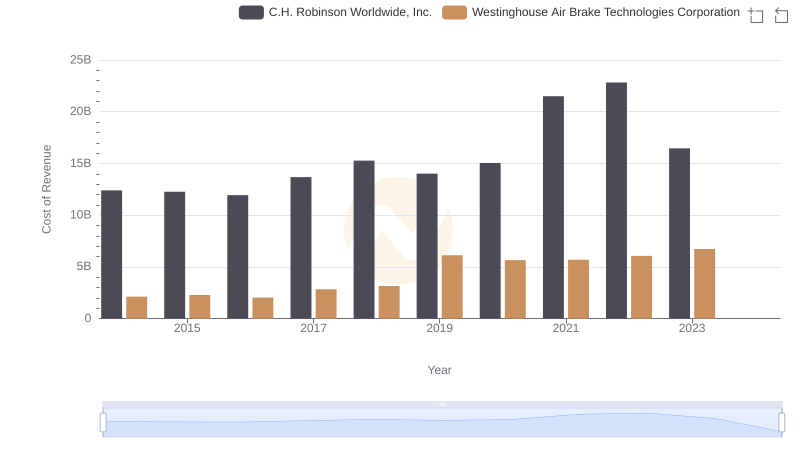
Cost of Revenue: Key Insights for Westinghouse Air Brake Technologies Corporation and C.H. Robinson Worldwide, Inc.
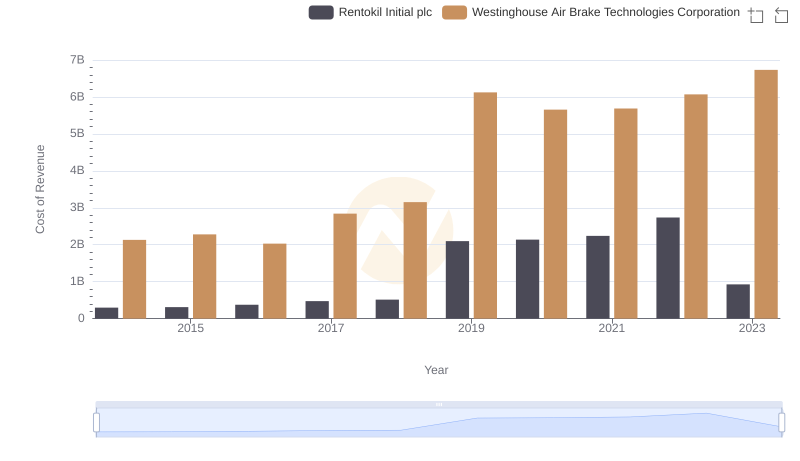
Comparing Cost of Revenue Efficiency: Westinghouse Air Brake Technologies Corporation vs Rentokil Initial plc
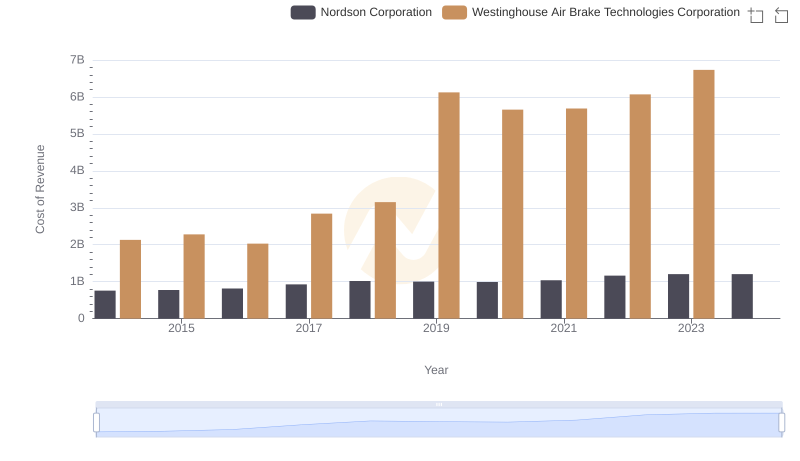
Cost Insights: Breaking Down Westinghouse Air Brake Technologies Corporation and Nordson Corporation's Expenses
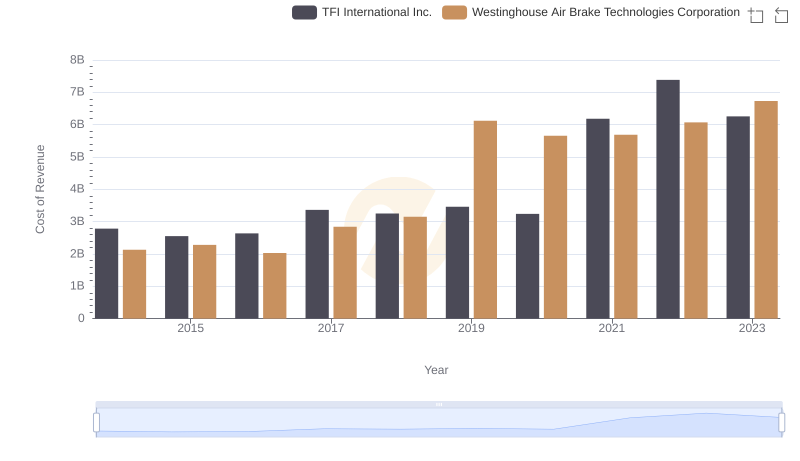
Cost of Revenue Trends: Westinghouse Air Brake Technologies Corporation vs TFI International Inc.
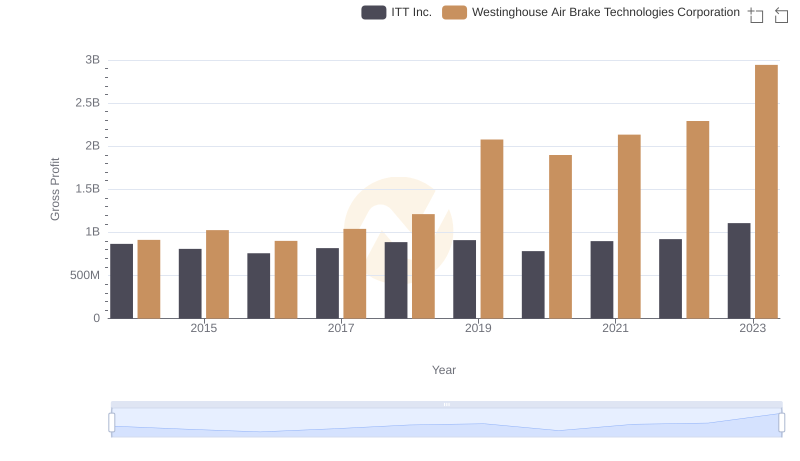
Gross Profit Analysis: Comparing Westinghouse Air Brake Technologies Corporation and ITT Inc.
Comparing Cost of Revenue Efficiency: Westinghouse Air Brake Technologies Corporation vs Allegion plc
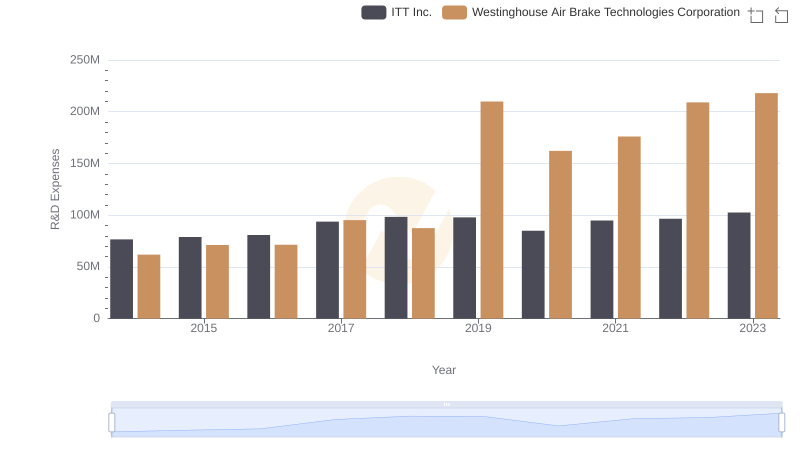
R&D Insights: How Westinghouse Air Brake Technologies Corporation and ITT Inc. Allocate Funds