| __timestamp | TFI International Inc. | Westinghouse Air Brake Technologies Corporation |
|---|---|---|
| Wednesday, January 1, 2014 | 2782605137 | 2130920000 |
| Thursday, January 1, 2015 | 2551474032 | 2281845000 |
| Friday, January 1, 2016 | 2636493564 | 2029647000 |
| Sunday, January 1, 2017 | 3364979721 | 2841159000 |
| Monday, January 1, 2018 | 3251443800 | 3151816000 |
| Tuesday, January 1, 2019 | 3461987950 | 6122400000 |
| Wednesday, January 1, 2020 | 3239249000 | 5657400000 |
| Friday, January 1, 2021 | 6182566000 | 5687000000 |
| Saturday, January 1, 2022 | 7385640000 | 6070000000 |
| Sunday, January 1, 2023 | 6255775000 | 6733000000 |
| Monday, January 1, 2024 | 7021000000 |
Infusing magic into the data realm
In the ever-evolving landscape of the transportation industry, Westinghouse Air Brake Technologies Corporation and TFI International Inc. have emerged as key players. Over the past decade, these companies have demonstrated significant shifts in their cost of revenue, reflecting broader industry trends and strategic decisions.
From 2014 to 2023, TFI International Inc. saw a remarkable 165% increase in its cost of revenue, peaking in 2022. This growth underscores TFI's aggressive expansion and adaptation strategies. Meanwhile, Westinghouse Air Brake Technologies Corporation experienced a 216% rise, with a notable surge in 2019, highlighting its robust response to market demands.
These trends not only illustrate the dynamic nature of the transportation sector but also emphasize the strategic maneuvers of these corporations in navigating economic challenges and opportunities. As we look to the future, these insights offer a glimpse into the potential trajectories of these industry titans.
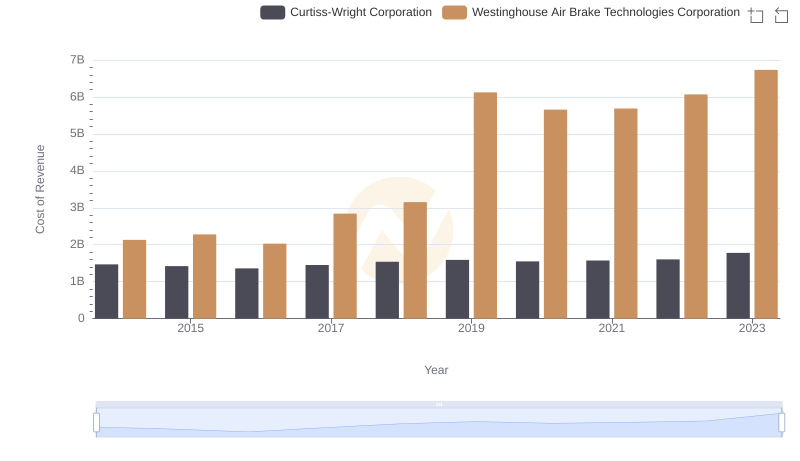
Westinghouse Air Brake Technologies Corporation vs Curtiss-Wright Corporation: Efficiency in Cost of Revenue Explored
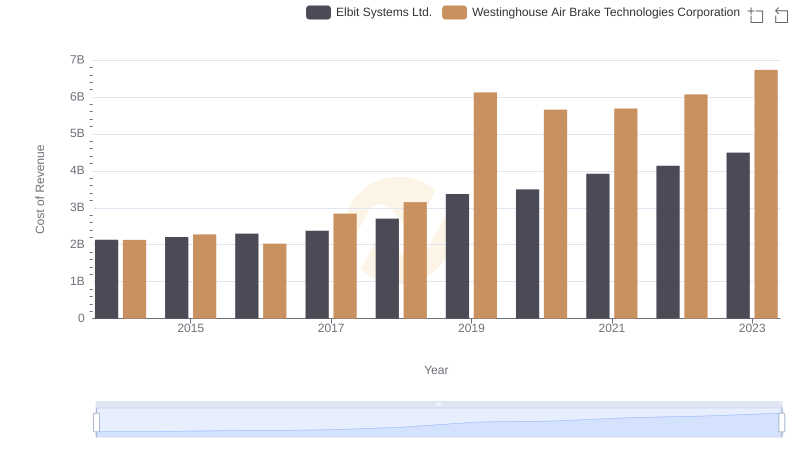
Cost of Revenue Trends: Westinghouse Air Brake Technologies Corporation vs Elbit Systems Ltd.
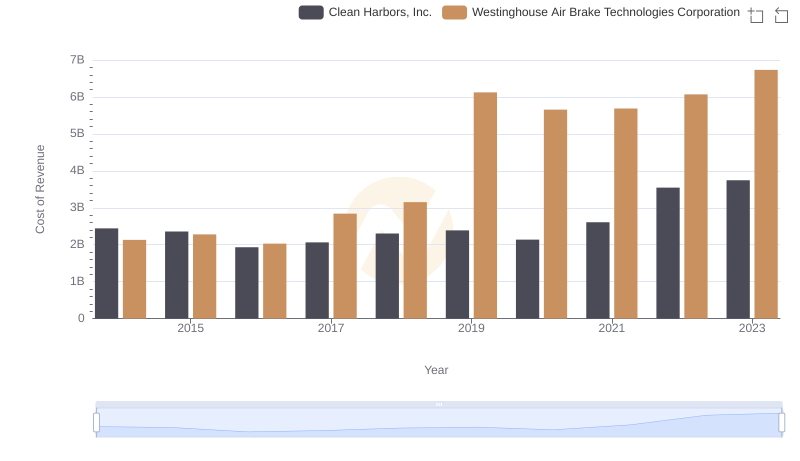
Comparing Cost of Revenue Efficiency: Westinghouse Air Brake Technologies Corporation vs Clean Harbors, Inc.
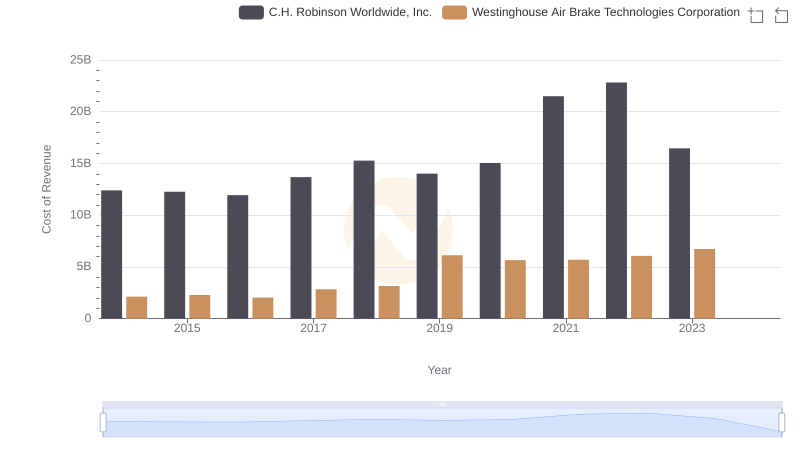
Cost of Revenue: Key Insights for Westinghouse Air Brake Technologies Corporation and C.H. Robinson Worldwide, Inc.
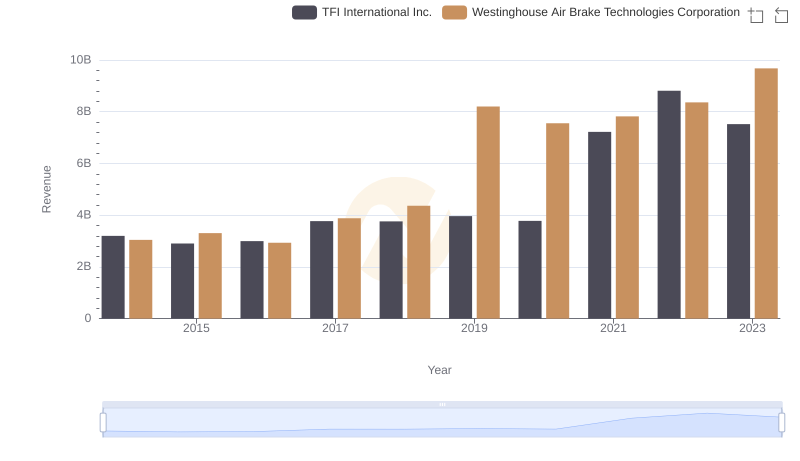
Westinghouse Air Brake Technologies Corporation or TFI International Inc.: Who Leads in Yearly Revenue?
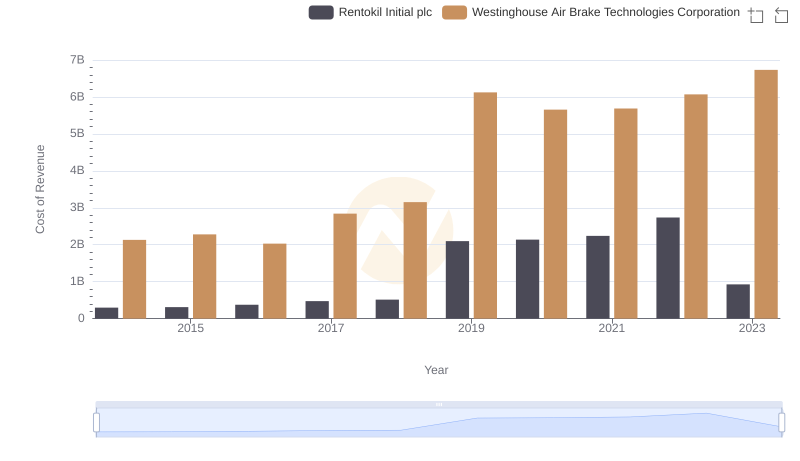
Comparing Cost of Revenue Efficiency: Westinghouse Air Brake Technologies Corporation vs Rentokil Initial plc
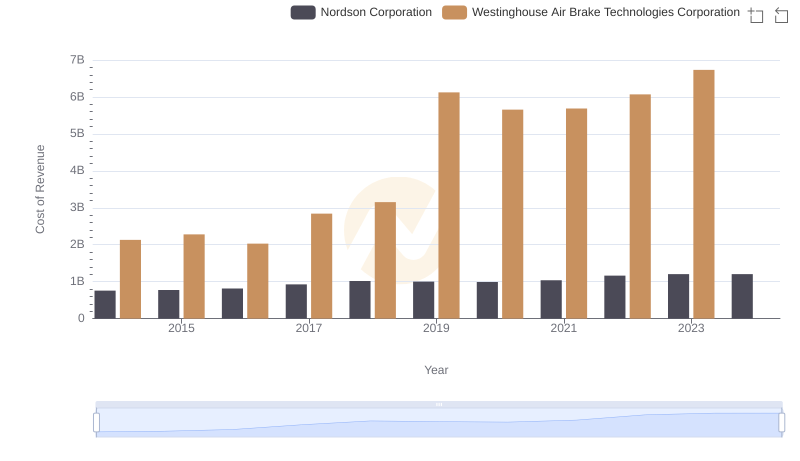
Cost Insights: Breaking Down Westinghouse Air Brake Technologies Corporation and Nordson Corporation's Expenses
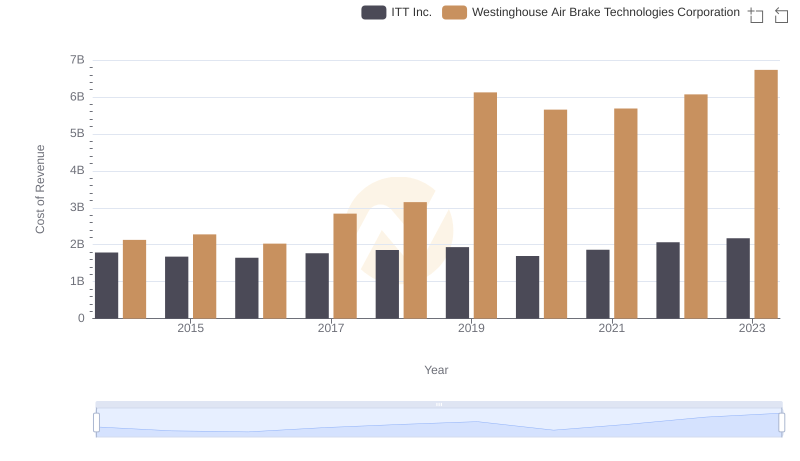
Cost of Revenue: Key Insights for Westinghouse Air Brake Technologies Corporation and ITT Inc.
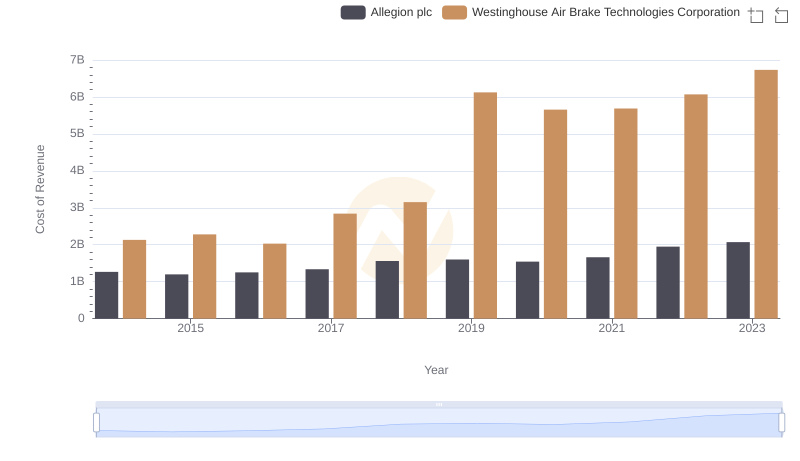
Comparing Cost of Revenue Efficiency: Westinghouse Air Brake Technologies Corporation vs Allegion plc
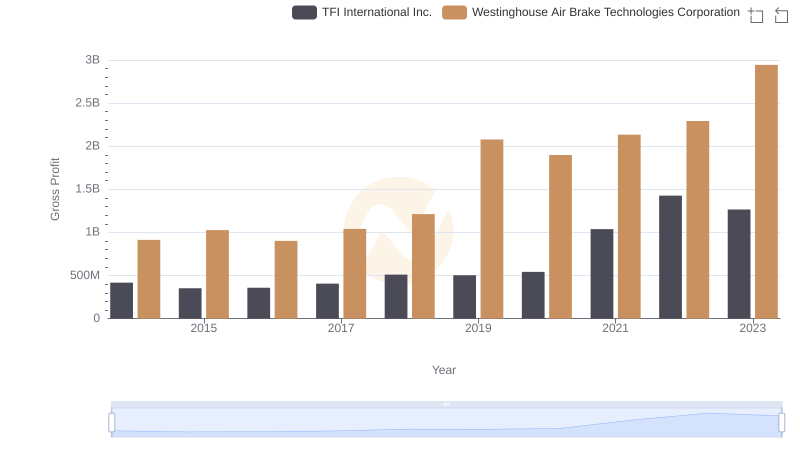
Gross Profit Comparison: Westinghouse Air Brake Technologies Corporation and TFI International Inc. Trends
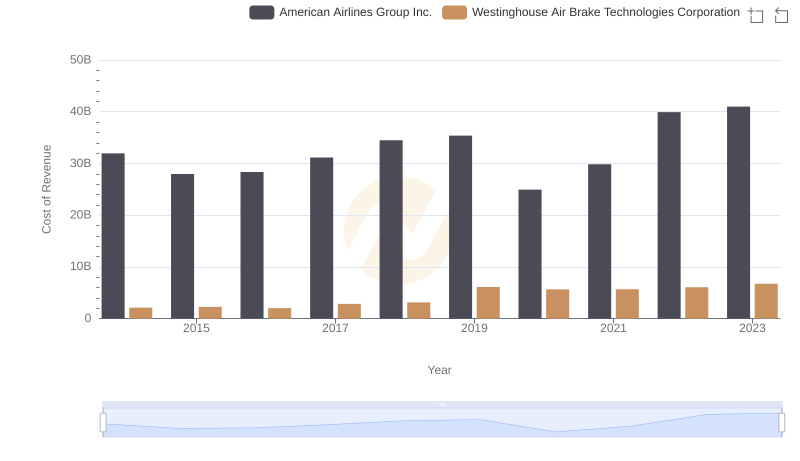
Westinghouse Air Brake Technologies Corporation vs American Airlines Group Inc.: Efficiency in Cost of Revenue Explored