| __timestamp | Rentokil Initial plc | Westinghouse Air Brake Technologies Corporation |
|---|---|---|
| Wednesday, January 1, 2014 | 297500000 | 2130920000 |
| Thursday, January 1, 2015 | 310200000 | 2281845000 |
| Friday, January 1, 2016 | 376100000 | 2029647000 |
| Sunday, January 1, 2017 | 474900000 | 2841159000 |
| Monday, January 1, 2018 | 514200000 | 3151816000 |
| Tuesday, January 1, 2019 | 2099000000 | 6122400000 |
| Wednesday, January 1, 2020 | 2136400000 | 5657400000 |
| Friday, January 1, 2021 | 2239100000 | 5687000000 |
| Saturday, January 1, 2022 | 2737000000 | 6070000000 |
| Sunday, January 1, 2023 | 927000000 | 6733000000 |
| Monday, January 1, 2024 | 7021000000 |
Unleashing the power of data
In the world of industrial giants, Westinghouse Air Brake Technologies Corporation and Rentokil Initial plc stand as titans in their respective fields. Over the past decade, from 2014 to 2023, these companies have showcased contrasting strategies in managing their cost of revenue. Westinghouse, a leader in rail technology, consistently reported higher costs, peaking at approximately $6.7 billion in 2023, reflecting its expansive operations. In contrast, Rentokil, a global pest control and hygiene services provider, maintained a more modest cost structure, with a notable spike in 2019 and 2020, reaching around $2.2 billion. This divergence highlights the distinct operational scales and market strategies of these companies. As we delve into this data, it becomes evident that while Westinghouse's costs are nearly three times that of Rentokil's, both companies have navigated their financial landscapes with unique approaches, adapting to market demands and economic shifts.
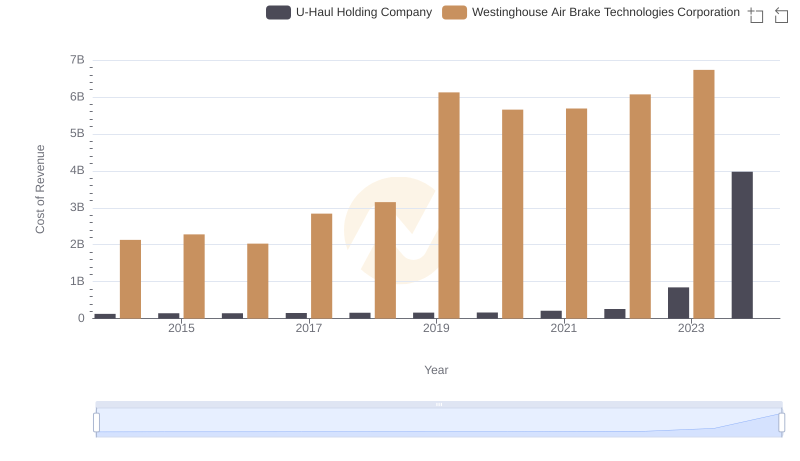
Cost Insights: Breaking Down Westinghouse Air Brake Technologies Corporation and U-Haul Holding Company's Expenses
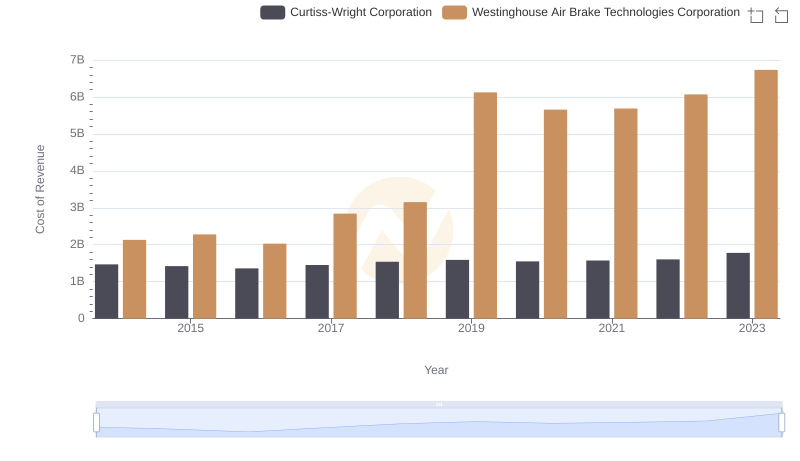
Westinghouse Air Brake Technologies Corporation vs Curtiss-Wright Corporation: Efficiency in Cost of Revenue Explored
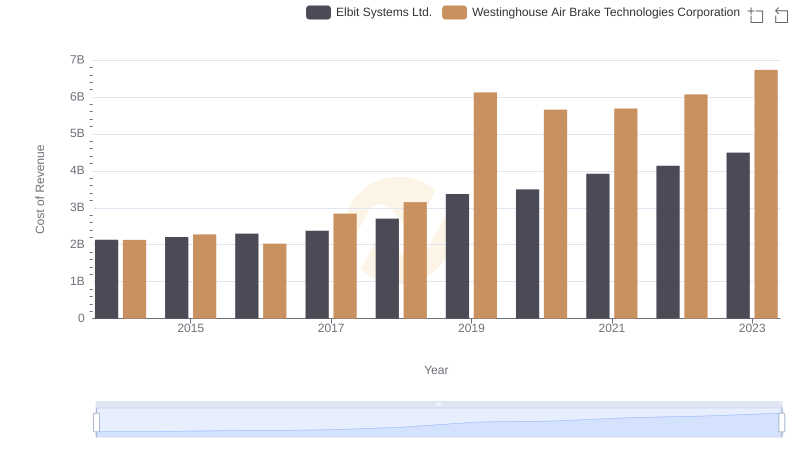
Cost of Revenue Trends: Westinghouse Air Brake Technologies Corporation vs Elbit Systems Ltd.
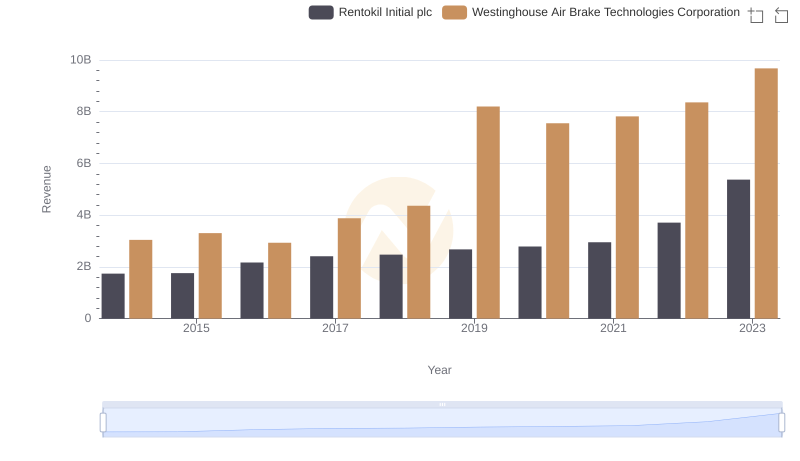
Revenue Insights: Westinghouse Air Brake Technologies Corporation and Rentokil Initial plc Performance Compared
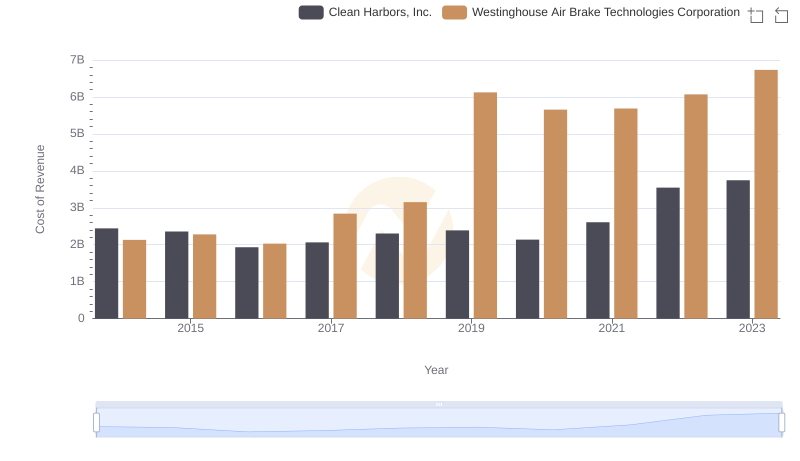
Comparing Cost of Revenue Efficiency: Westinghouse Air Brake Technologies Corporation vs Clean Harbors, Inc.
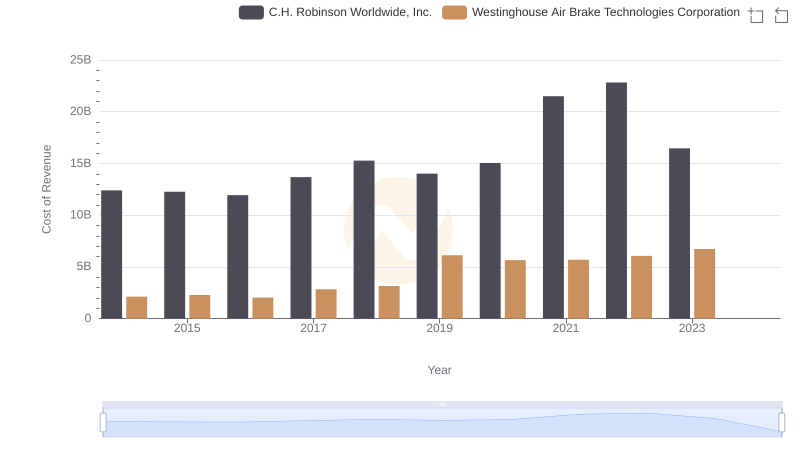
Cost of Revenue: Key Insights for Westinghouse Air Brake Technologies Corporation and C.H. Robinson Worldwide, Inc.
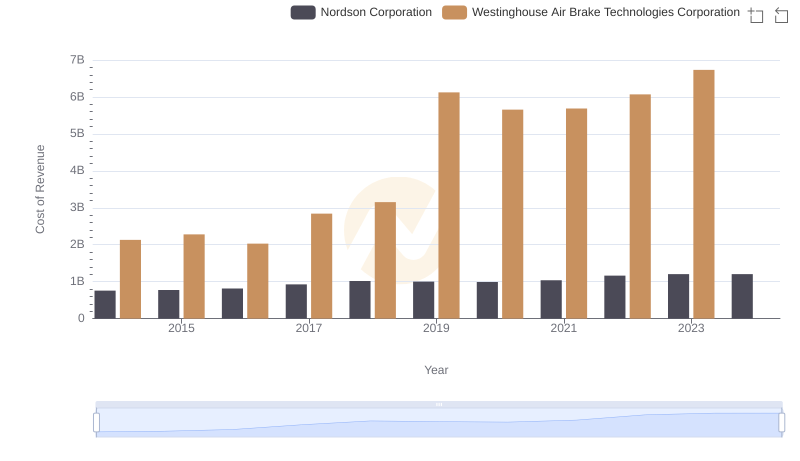
Cost Insights: Breaking Down Westinghouse Air Brake Technologies Corporation and Nordson Corporation's Expenses
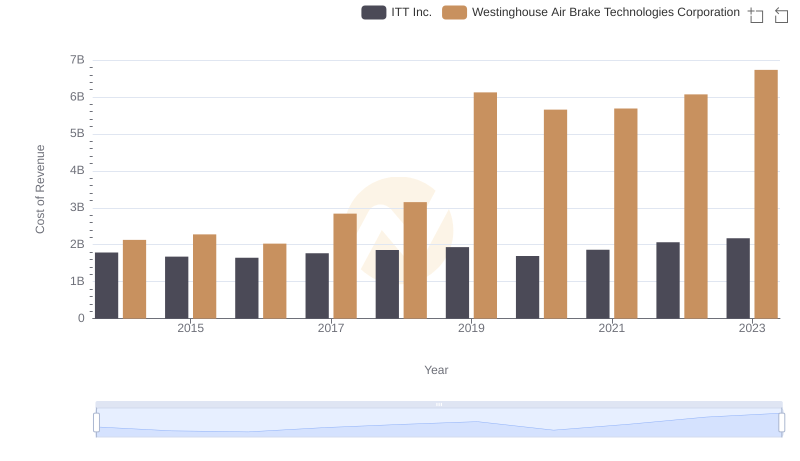
Cost of Revenue: Key Insights for Westinghouse Air Brake Technologies Corporation and ITT Inc.
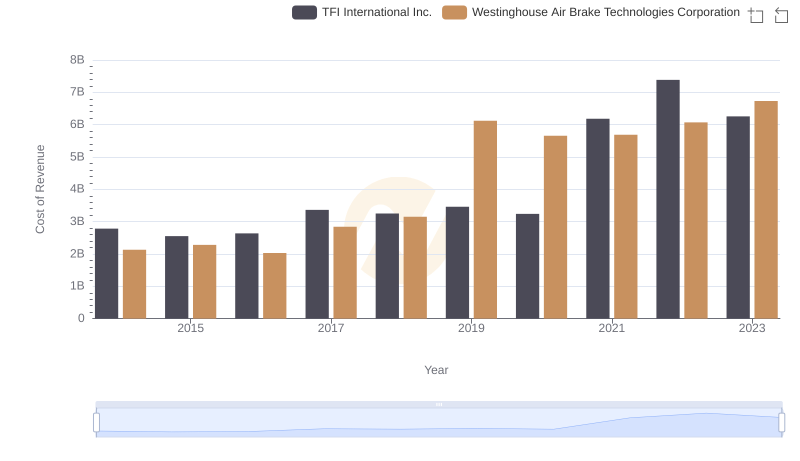
Cost of Revenue Trends: Westinghouse Air Brake Technologies Corporation vs TFI International Inc.
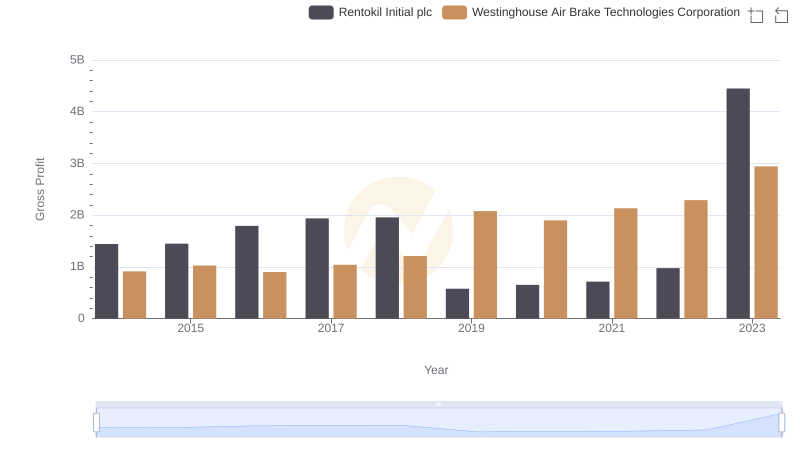
Who Generates Higher Gross Profit? Westinghouse Air Brake Technologies Corporation or Rentokil Initial plc
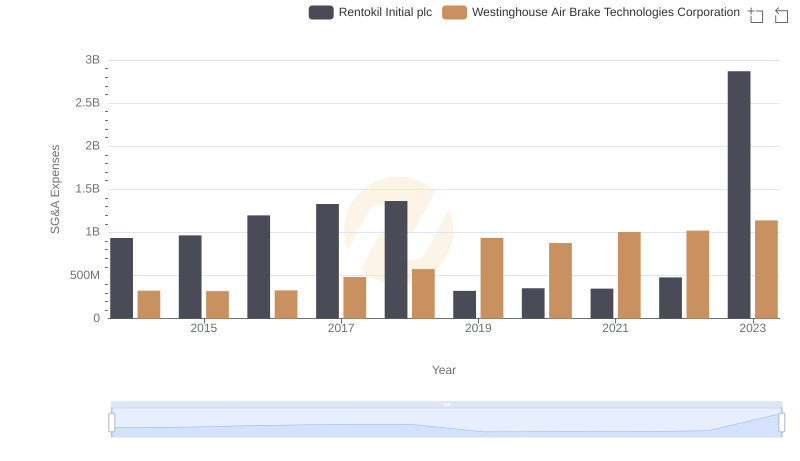
Westinghouse Air Brake Technologies Corporation and Rentokil Initial plc: SG&A Spending Patterns Compared