| __timestamp | United Airlines Holdings, Inc. | Waste Management, Inc. |
|---|---|---|
| Wednesday, January 1, 2014 | 1373000000 | 1481000000 |
| Thursday, January 1, 2015 | 1342000000 | 1343000000 |
| Friday, January 1, 2016 | 1303000000 | 1410000000 |
| Sunday, January 1, 2017 | 1349000000 | 1468000000 |
| Monday, January 1, 2018 | 1558000000 | 1453000000 |
| Tuesday, January 1, 2019 | 1651000000 | 1631000000 |
| Wednesday, January 1, 2020 | 459000000 | 1728000000 |
| Friday, January 1, 2021 | 677000000 | 1864000000 |
| Saturday, January 1, 2022 | 1535000000 | 1938000000 |
| Sunday, January 1, 2023 | 1977000000 | 1926000000 |
| Monday, January 1, 2024 | 2231000000 | 2264000000 |
Unleashing insights
In the ever-evolving landscape of corporate finance, understanding the trends in Selling, General, and Administrative (SG&A) expenses is crucial. Over the past decade, Waste Management, Inc. and United Airlines Holdings, Inc. have shown distinct trajectories in their SG&A expenses. From 2014 to 2023, Waste Management's expenses grew steadily, peaking in 2022 with a 30% increase from 2014. In contrast, United Airlines experienced a significant dip in 2020, with expenses dropping by 66% compared to the previous year, likely due to the pandemic's impact on the airline industry. However, by 2023, United Airlines rebounded, surpassing its 2019 levels by 20%. This comparison highlights the resilience and adaptability of these companies in managing operational costs amidst varying economic conditions.
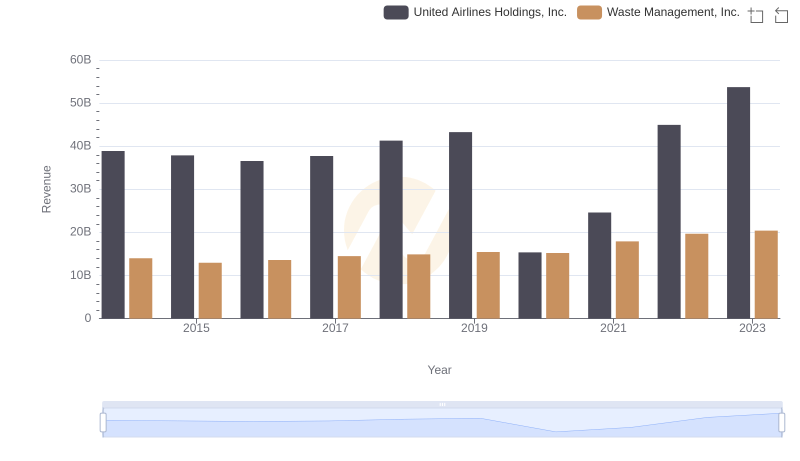
Waste Management, Inc. and United Airlines Holdings, Inc.: A Comprehensive Revenue Analysis
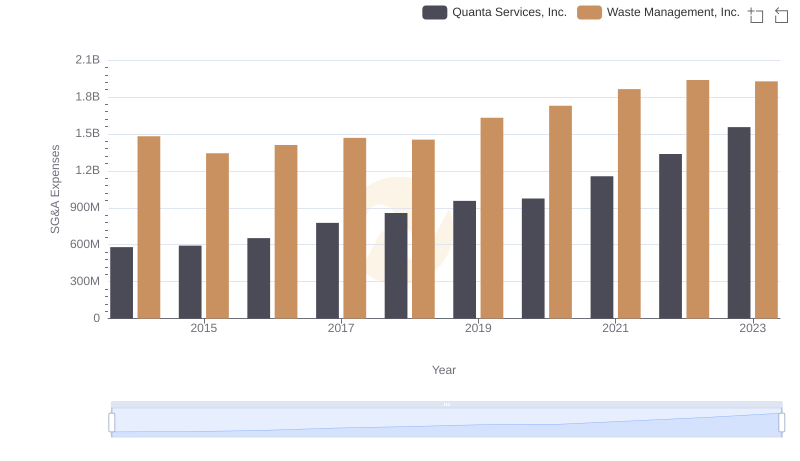
Operational Costs Compared: SG&A Analysis of Waste Management, Inc. and Quanta Services, Inc.
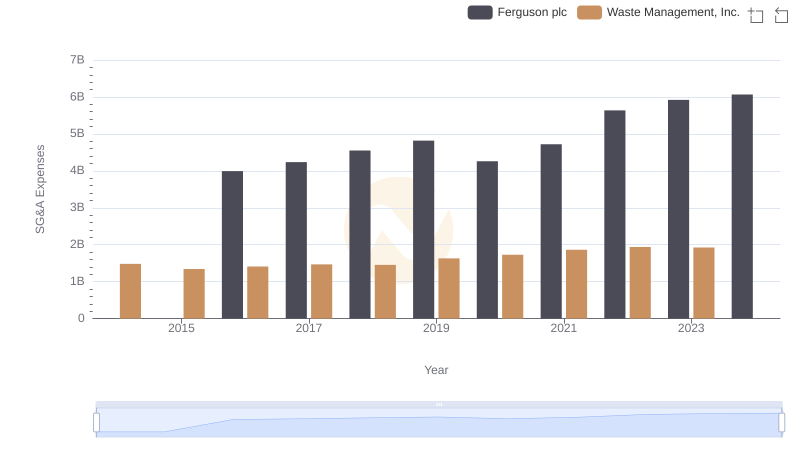
Breaking Down SG&A Expenses: Waste Management, Inc. vs Ferguson plc

SG&A Efficiency Analysis: Comparing Waste Management, Inc. and Old Dominion Freight Line, Inc.
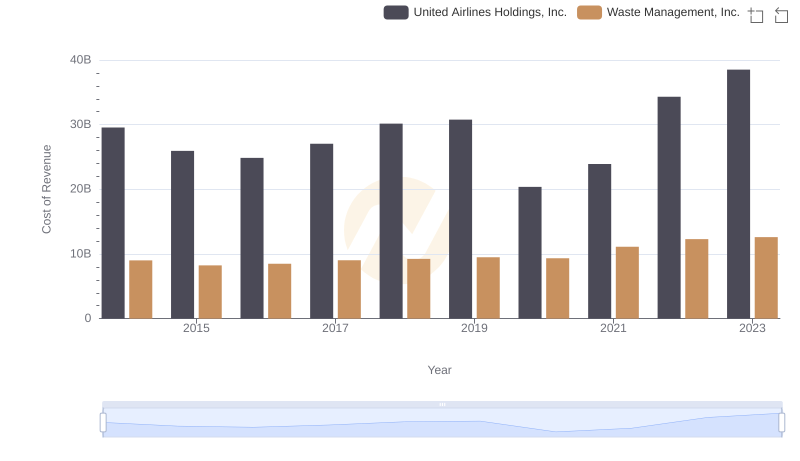
Cost Insights: Breaking Down Waste Management, Inc. and United Airlines Holdings, Inc.'s Expenses
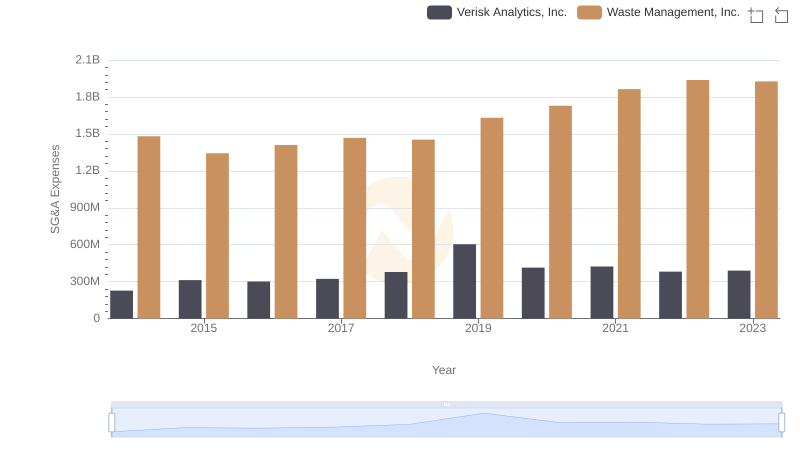
Breaking Down SG&A Expenses: Waste Management, Inc. vs Verisk Analytics, Inc.

Comparing SG&A Expenses: Waste Management, Inc. vs Ingersoll Rand Inc. Trends and Insights
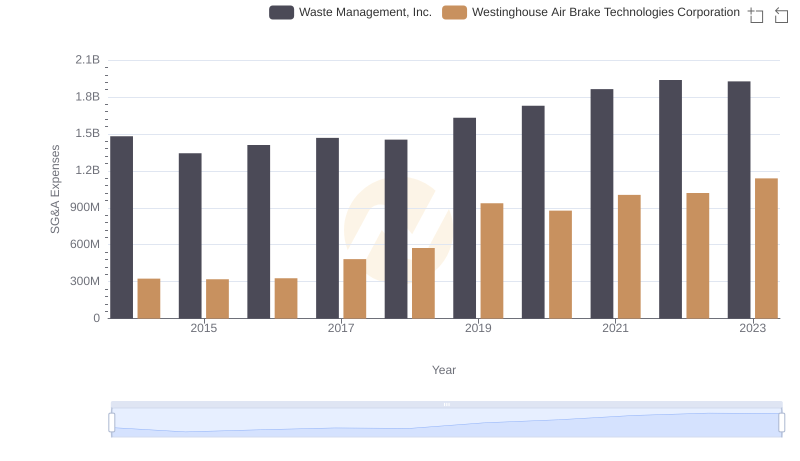
Who Optimizes SG&A Costs Better? Waste Management, Inc. or Westinghouse Air Brake Technologies Corporation
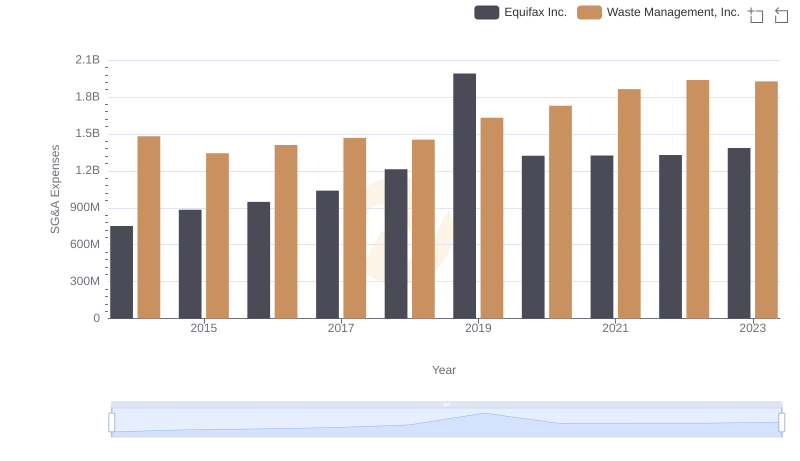
Waste Management, Inc. vs Equifax Inc.: SG&A Expense Trends
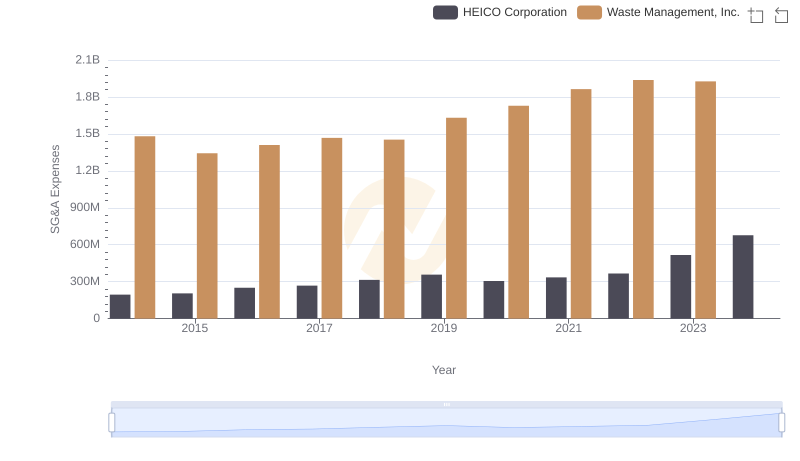
Breaking Down SG&A Expenses: Waste Management, Inc. vs HEICO Corporation
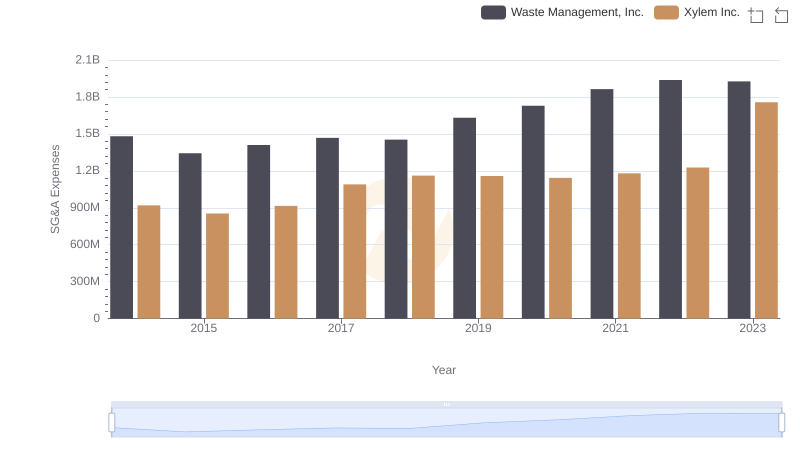
Breaking Down SG&A Expenses: Waste Management, Inc. vs Xylem Inc.
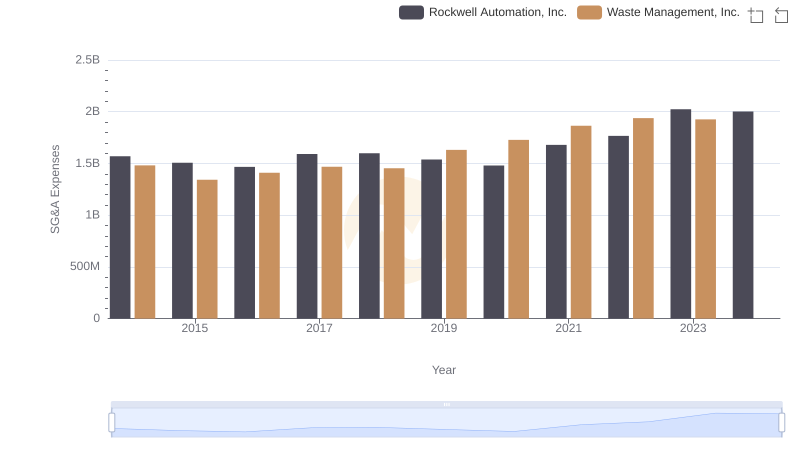
Cost Management Insights: SG&A Expenses for Waste Management, Inc. and Rockwell Automation, Inc.