| __timestamp | Waste Management, Inc. | Xylem Inc. |
|---|---|---|
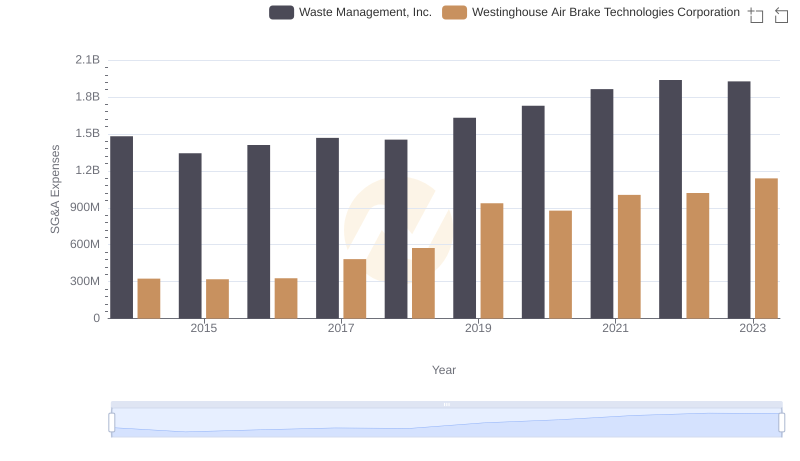
| Wednesday, January 1, 2014 | 1481000000 | 920000000 |
| Thursday, January 1, 2015 | 1343000000 | 854000000 |
| Friday, January 1, 2016 | 1410000000 | 915000000 |
| Sunday, January 1, 2017 | 1468000000 | 1090000000 |
| Monday, January 1, 2018 | 1453000000 | 1161000000 |
| Tuesday, January 1, 2019 | 1631000000 | 1158000000 |
| Wednesday, January 1, 2020 | 1728000000 | 1143000000 |
| Friday, January 1, 2021 | 1864000000 | 1179000000 |
| Saturday, January 1, 2022 | 1938000000 | 1227000000 |
| Sunday, January 1, 2023 | 1926000000 | 1757000000 |
| Monday, January 1, 2024 | 2264000000 |
Unlocking the unknown
In the world of corporate finance, Selling, General, and Administrative (SG&A) expenses are a critical measure of a company's operational efficiency. Waste Management, Inc. and Xylem Inc., two giants in their respective industries, offer a fascinating comparison over the past decade.
From 2014 to 2023, Waste Management, Inc. has seen a steady increase in SG&A expenses, peaking in 2022 at nearly 1.94 billion dollars. This represents a 30% increase from 2014, reflecting the company's expansion and increased operational costs.
Xylem Inc., on the other hand, has experienced a more volatile trend. Starting at 920 million dollars in 2014, their SG&A expenses surged by 91% to reach 1.76 billion dollars in 2023. This sharp rise indicates significant investments in growth and innovation.
Both companies highlight the dynamic nature of SG&A expenses and their impact on financial health.
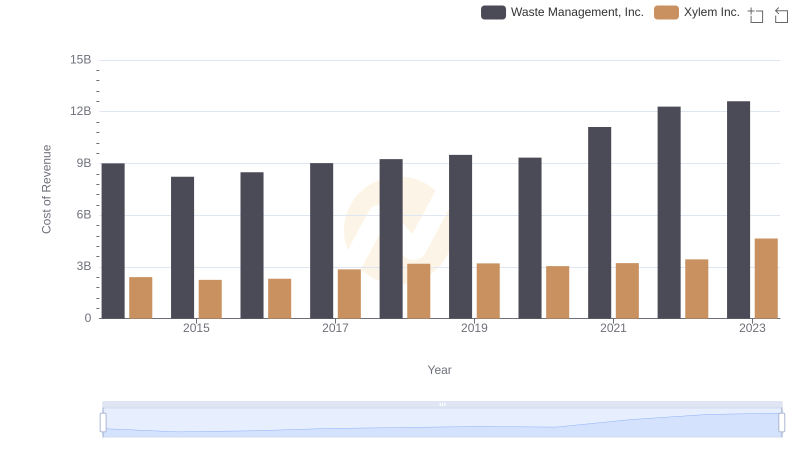
Cost of Revenue: Key Insights for Waste Management, Inc. and Xylem Inc.
Who Optimizes SG&A Costs Better? Waste Management, Inc. or Westinghouse Air Brake Technologies Corporation
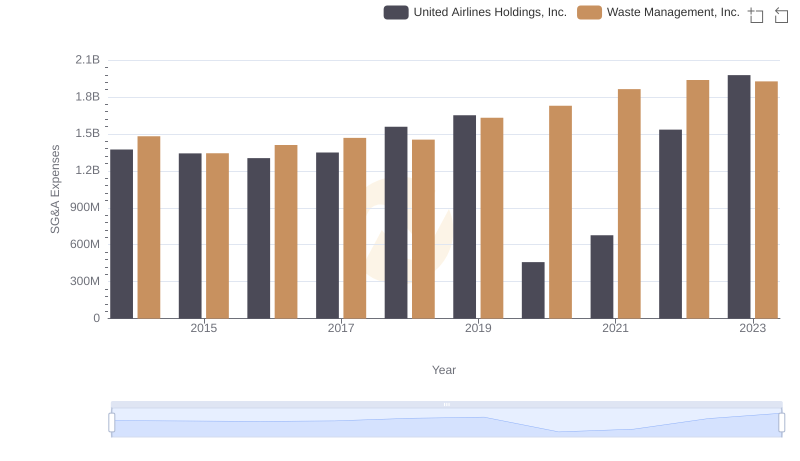
Waste Management, Inc. vs United Airlines Holdings, Inc.: SG&A Expense Trends
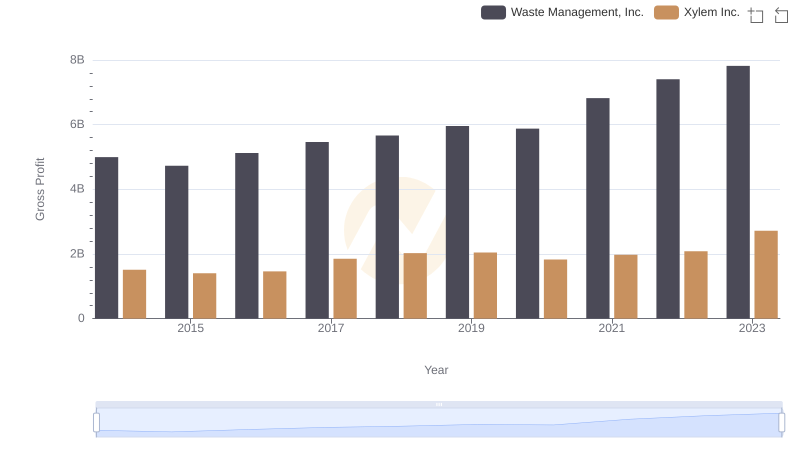
Gross Profit Trends Compared: Waste Management, Inc. vs Xylem Inc.
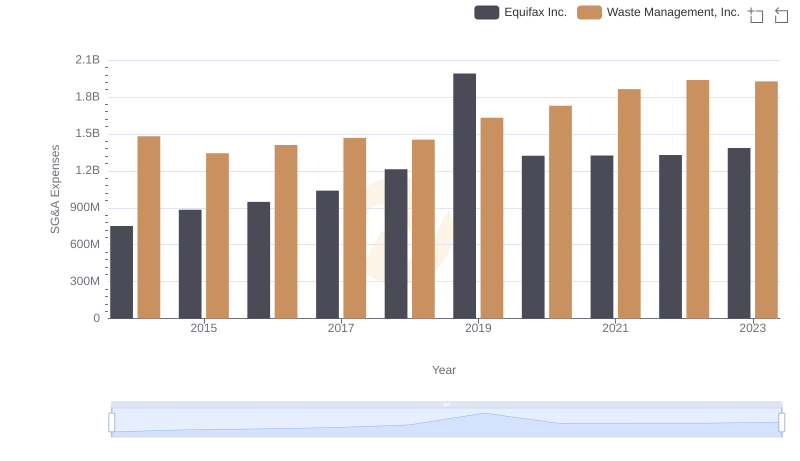
Waste Management, Inc. vs Equifax Inc.: SG&A Expense Trends
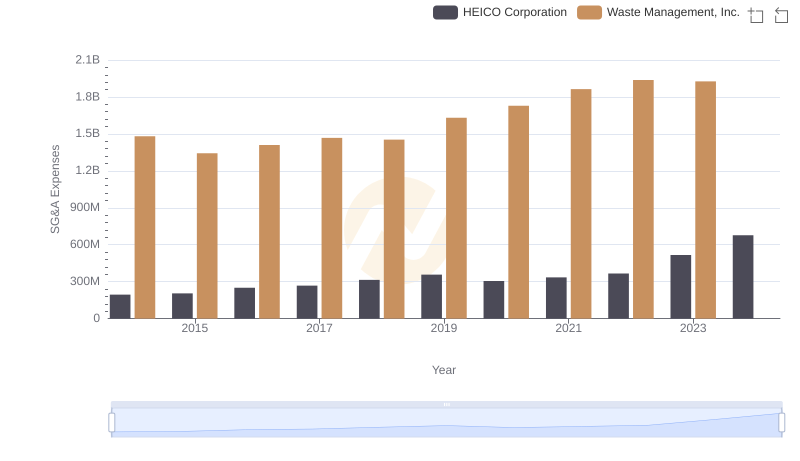
Breaking Down SG&A Expenses: Waste Management, Inc. vs HEICO Corporation
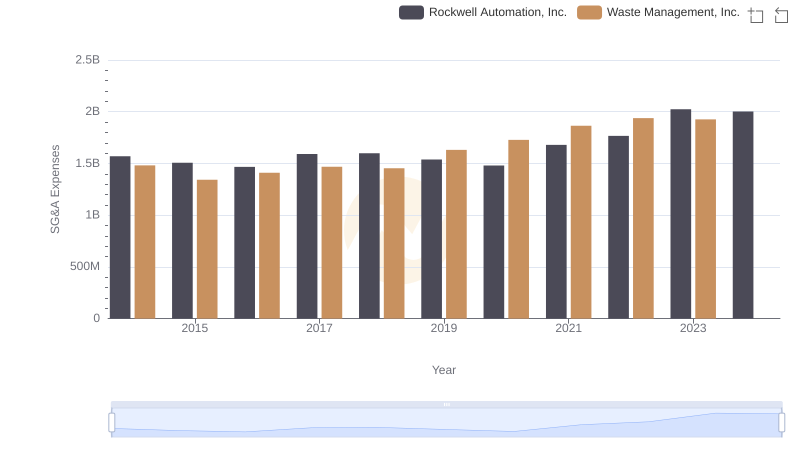
Cost Management Insights: SG&A Expenses for Waste Management, Inc. and Rockwell Automation, Inc.
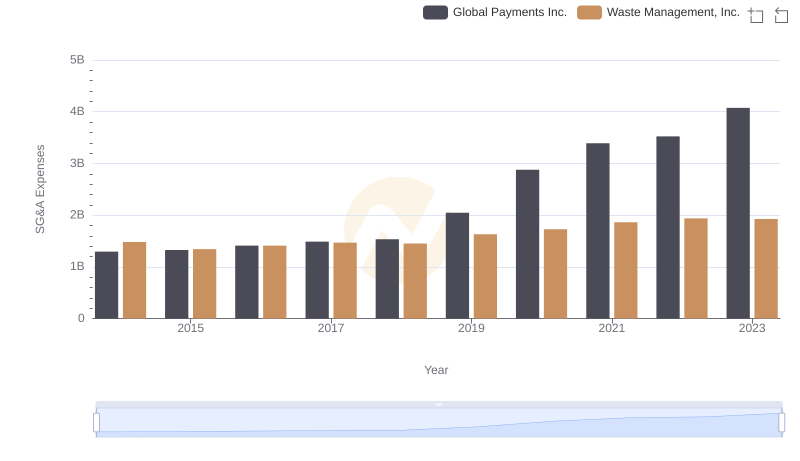
Waste Management, Inc. vs Global Payments Inc.: SG&A Expense Trends
Waste Management, Inc. vs Lennox International Inc.: SG&A Expense Trends