| __timestamp | Rockwell Automation, Inc. | Waste Management, Inc. |
|---|---|---|
| Wednesday, January 1, 2014 | 1570100000 | 1481000000 |
| Thursday, January 1, 2015 | 1506400000 | 1343000000 |
| Friday, January 1, 2016 | 1467400000 | 1410000000 |
| Sunday, January 1, 2017 | 1591500000 | 1468000000 |
| Monday, January 1, 2018 | 1599000000 | 1453000000 |
| Tuesday, January 1, 2019 | 1538500000 | 1631000000 |
| Wednesday, January 1, 2020 | 1479800000 | 1728000000 |
| Friday, January 1, 2021 | 1680000000 | 1864000000 |
| Saturday, January 1, 2022 | 1766700000 | 1938000000 |
| Sunday, January 1, 2023 | 2023700000 | 1926000000 |
| Monday, January 1, 2024 | 2002600000 | 2264000000 |
In pursuit of knowledge
In the ever-evolving landscape of corporate finance, effective cost management is crucial. This analysis delves into the Selling, General, and Administrative (SG&A) expenses of two industry titans: Rockwell Automation, Inc. and Waste Management, Inc., from 2014 to 2023. Over this decade, Rockwell Automation's SG&A expenses have surged by approximately 29%, peaking in 2023. Meanwhile, Waste Management saw a 30% increase, with a notable rise in 2022.
The data for 2024 remains incomplete, offering a glimpse into the challenges of forecasting in dynamic markets. As these companies navigate future fiscal landscapes, their SG&A trends provide valuable insights into their strategic priorities.
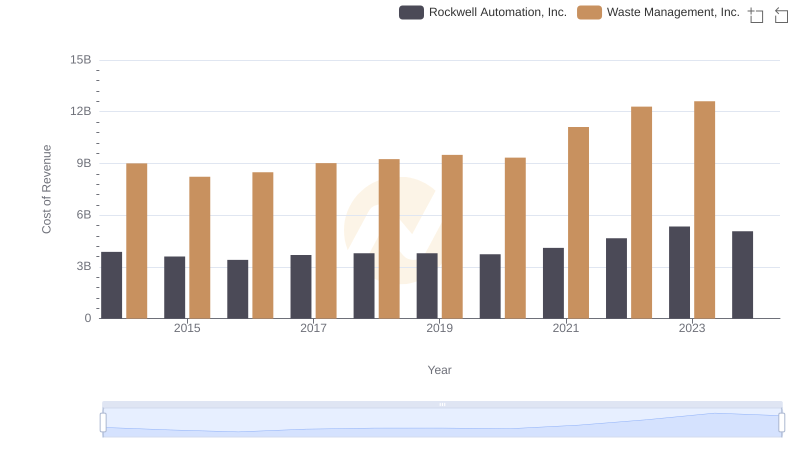
Cost of Revenue: Key Insights for Waste Management, Inc. and Rockwell Automation, Inc.
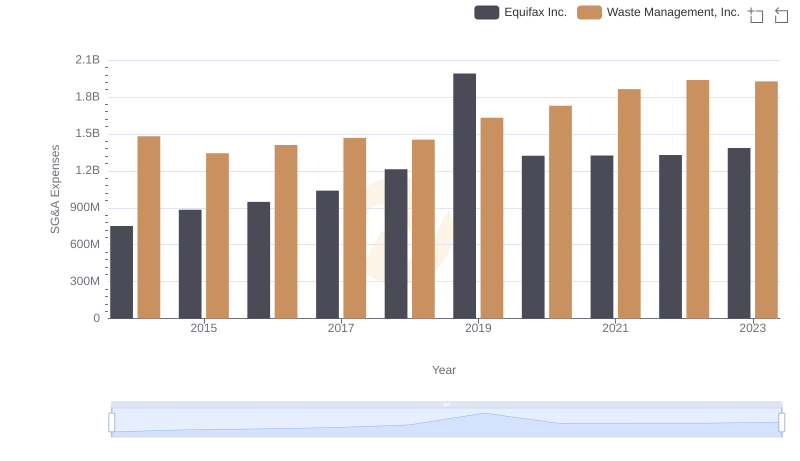
Waste Management, Inc. vs Equifax Inc.: SG&A Expense Trends
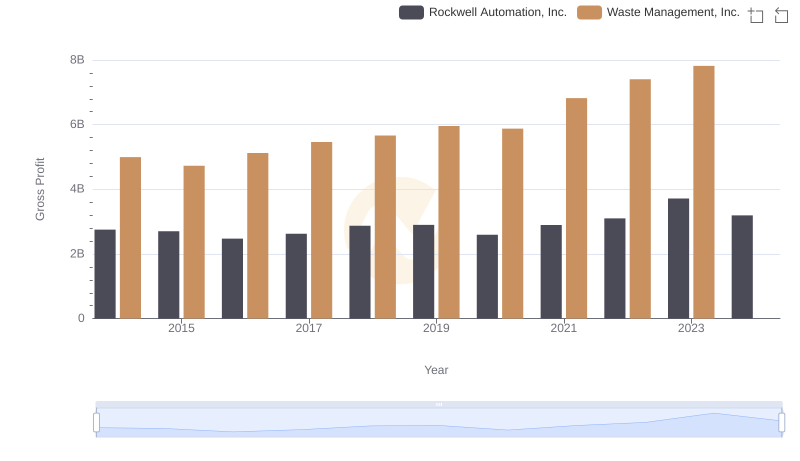
Gross Profit Comparison: Waste Management, Inc. and Rockwell Automation, Inc. Trends
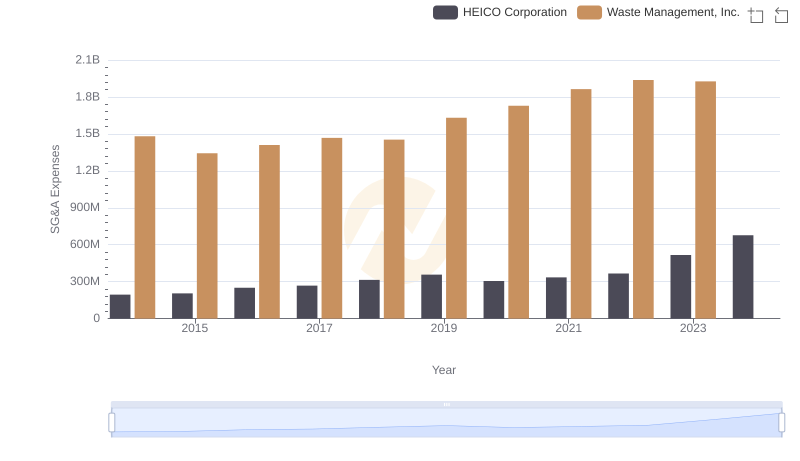
Breaking Down SG&A Expenses: Waste Management, Inc. vs HEICO Corporation
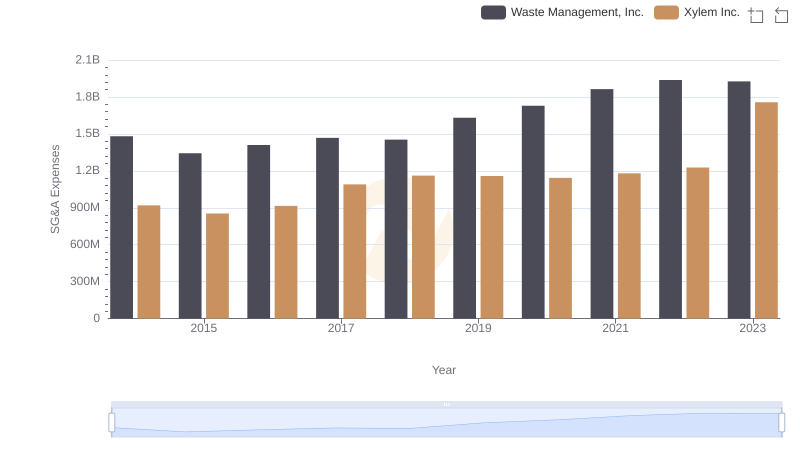
Breaking Down SG&A Expenses: Waste Management, Inc. vs Xylem Inc.
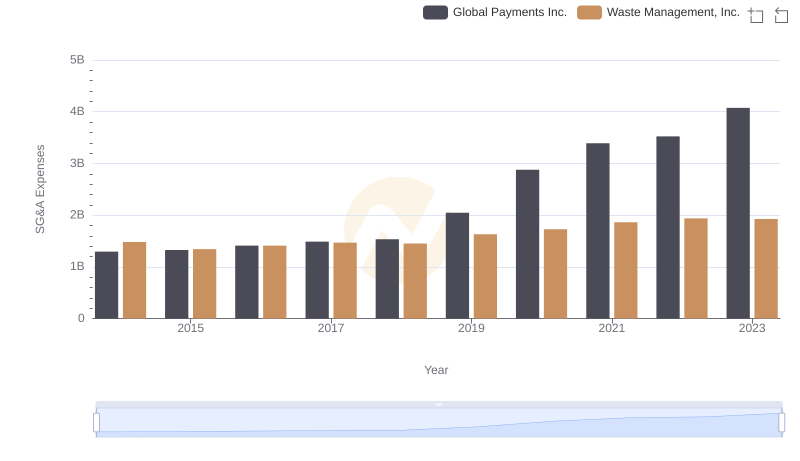
Waste Management, Inc. vs Global Payments Inc.: SG&A Expense Trends
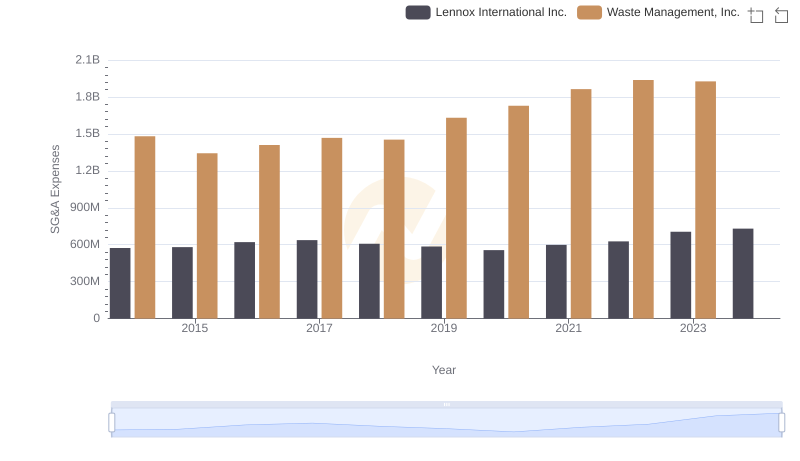
Waste Management, Inc. vs Lennox International Inc.: SG&A Expense Trends