| __timestamp | United Airlines Holdings, Inc. | Waste Management, Inc. |
|---|---|---|
| Wednesday, January 1, 2014 | 38901000000 | 13996000000 |
| Thursday, January 1, 2015 | 37864000000 | 12961000000 |
| Friday, January 1, 2016 | 36556000000 | 13609000000 |
| Sunday, January 1, 2017 | 37736000000 | 14485000000 |
| Monday, January 1, 2018 | 41303000000 | 14914000000 |
| Tuesday, January 1, 2019 | 43259000000 | 15455000000 |
| Wednesday, January 1, 2020 | 15355000000 | 15218000000 |
| Friday, January 1, 2021 | 24634000000 | 17931000000 |
| Saturday, January 1, 2022 | 44955000000 | 19698000000 |
| Sunday, January 1, 2023 | 53717000000 | 20426000000 |
| Monday, January 1, 2024 | 57063000000 | 22063000000 |
Infusing magic into the data realm
In the ever-evolving landscape of American industry, Waste Management, Inc. and United Airlines Holdings, Inc. stand as titans in their respective fields. Over the past decade, these companies have navigated economic turbulence and industry shifts, showcasing resilience and adaptability.
From 2014 to 2023, United Airlines experienced a remarkable revenue growth of approximately 38%, despite a significant dip in 2020 due to the global pandemic. By 2023, their revenue soared to over 50% higher than their 2014 figures, reflecting a robust recovery and expansion.
Conversely, Waste Management's revenue grew steadily by about 46% over the same period, highlighting the consistent demand for waste services. Their revenue peaked in 2023, marking a 46% increase from 2014, underscoring their strategic growth and operational efficiency.
These trends reveal the dynamic nature of these industries and the strategic prowess of these companies in navigating challenges and capitalizing on opportunities.

Revenue Showdown: Waste Management, Inc. vs Old Dominion Freight Line, Inc.
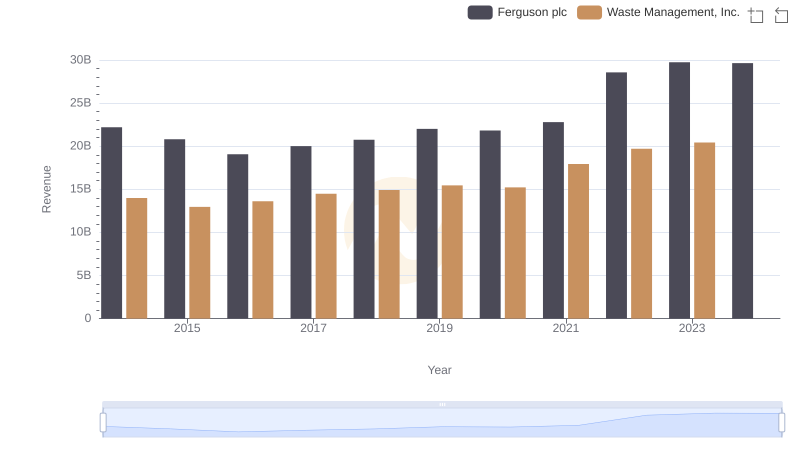
Revenue Insights: Waste Management, Inc. and Ferguson plc Performance Compared
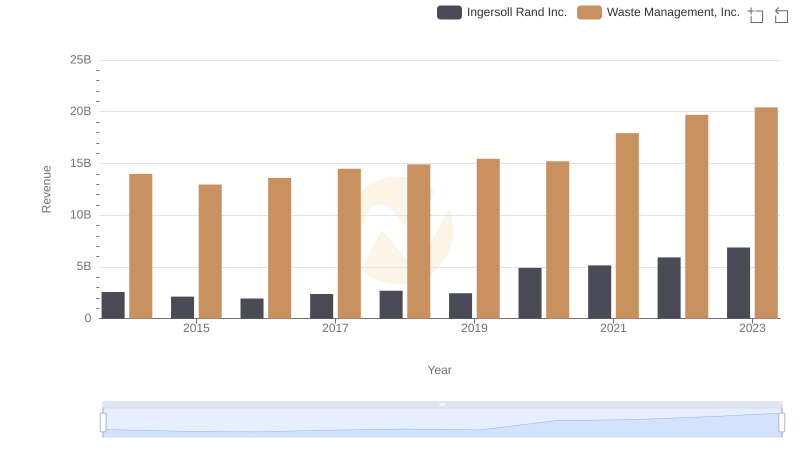
Annual Revenue Comparison: Waste Management, Inc. vs Ingersoll Rand Inc.
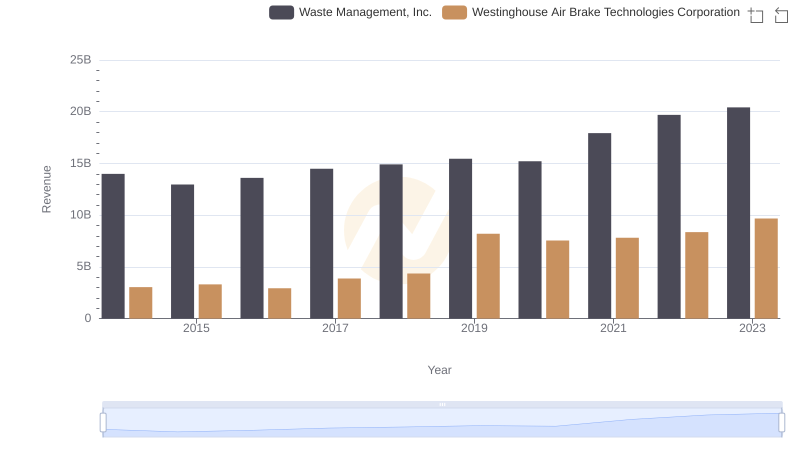
Revenue Showdown: Waste Management, Inc. vs Westinghouse Air Brake Technologies Corporation
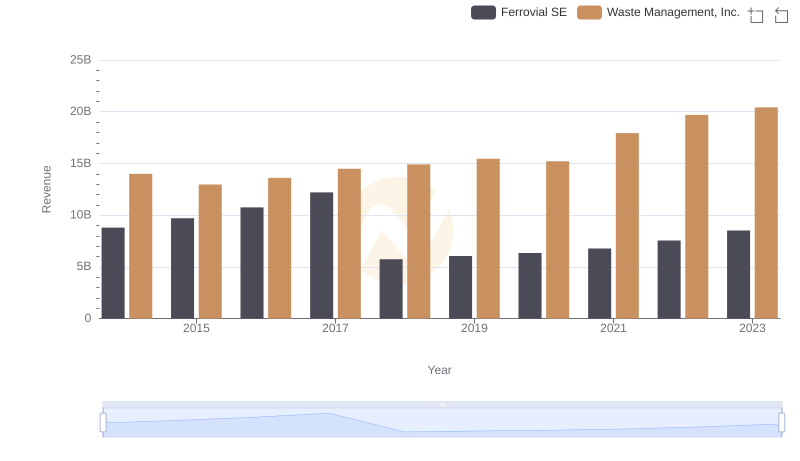
Waste Management, Inc. or Ferrovial SE: Who Leads in Yearly Revenue?
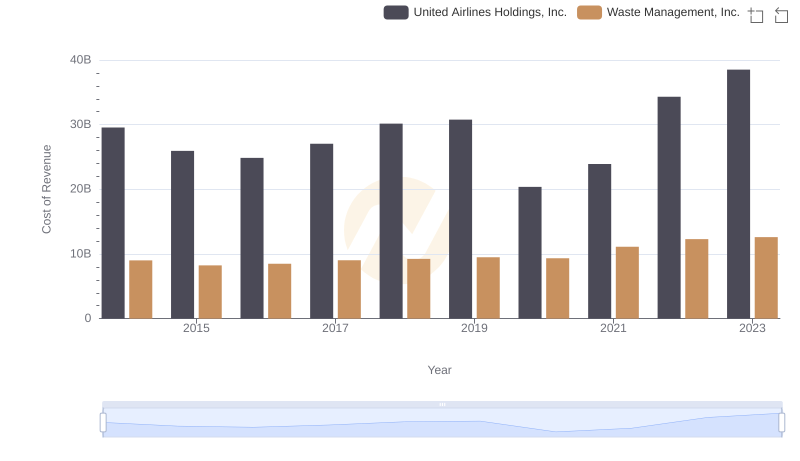
Cost Insights: Breaking Down Waste Management, Inc. and United Airlines Holdings, Inc.'s Expenses
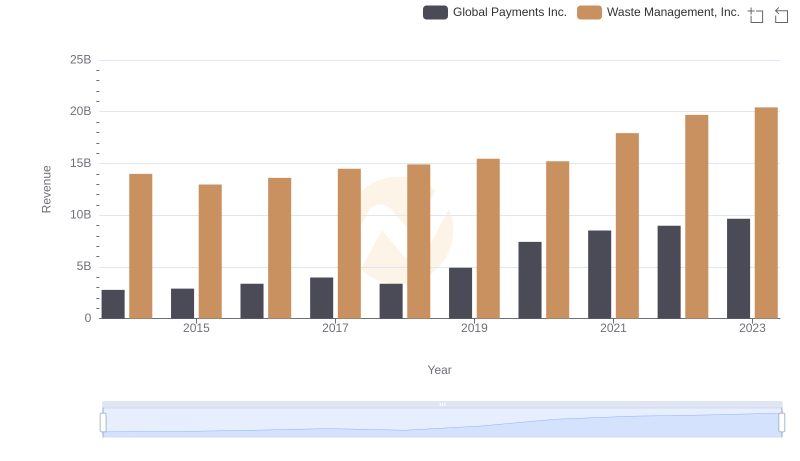
Revenue Showdown: Waste Management, Inc. vs Global Payments Inc.
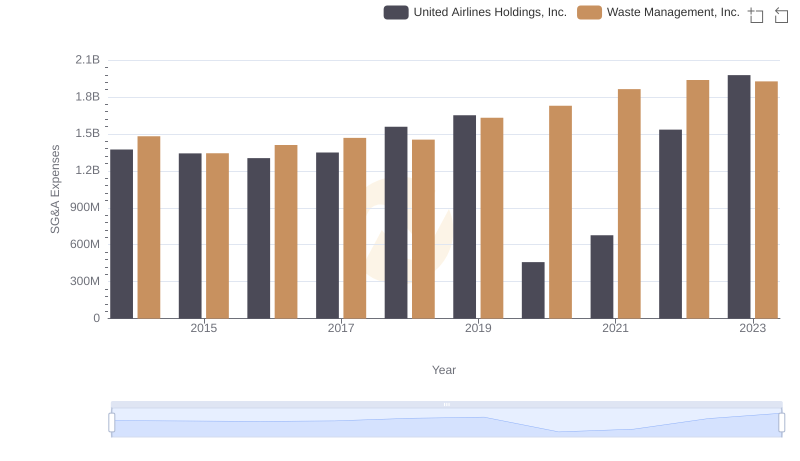
Waste Management, Inc. vs United Airlines Holdings, Inc.: SG&A Expense Trends