| __timestamp | United Airlines Holdings, Inc. | Waste Management, Inc. |
|---|---|---|
| Wednesday, January 1, 2014 | 29569000000 | 9002000000 |
| Thursday, January 1, 2015 | 25952000000 | 8231000000 |
| Friday, January 1, 2016 | 24856000000 | 8486000000 |
| Sunday, January 1, 2017 | 27056000000 | 9021000000 |
| Monday, January 1, 2018 | 30165000000 | 9249000000 |
| Tuesday, January 1, 2019 | 30786000000 | 9496000000 |
| Wednesday, January 1, 2020 | 20385000000 | 9341000000 |
| Friday, January 1, 2021 | 23913000000 | 11111000000 |
| Saturday, January 1, 2022 | 34315000000 | 12294000000 |
| Sunday, January 1, 2023 | 38518000000 | 12606000000 |
| Monday, January 1, 2024 | 37643000000 | 13383000000 |
Unleashing insights
In the ever-evolving landscape of corporate expenses, understanding cost structures is crucial. This analysis delves into the cost of revenue for Waste Management, Inc. and United Airlines Holdings, Inc. from 2014 to 2023. Over this period, United Airlines experienced a significant fluctuation, with costs peaking in 2023 at approximately 35% higher than in 2014. This reflects the airline industry's volatile nature, influenced by factors like fuel prices and global events. Conversely, Waste Management's costs showed a steady increase, rising by about 40% over the same period, highlighting the company's consistent growth and operational expansion. Notably, 2020 marked a downturn for United Airlines, with costs dropping by 33% compared to the previous year, likely due to the pandemic's impact. This comparative insight underscores the diverse challenges and growth trajectories faced by these industry giants.
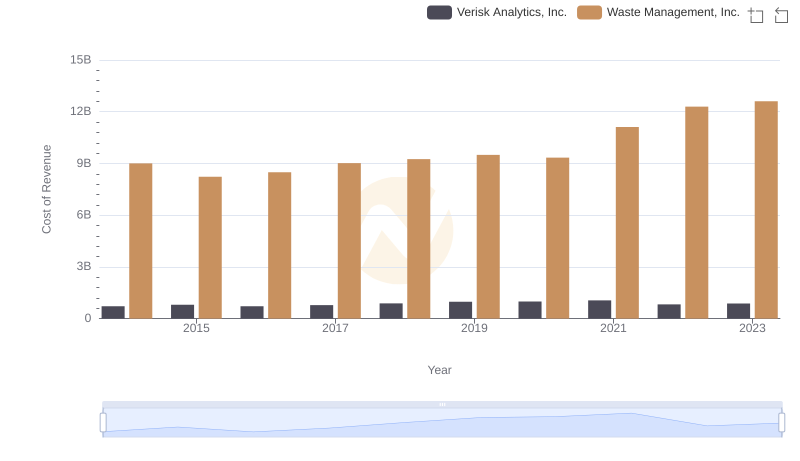
Comparing Cost of Revenue Efficiency: Waste Management, Inc. vs Verisk Analytics, Inc.
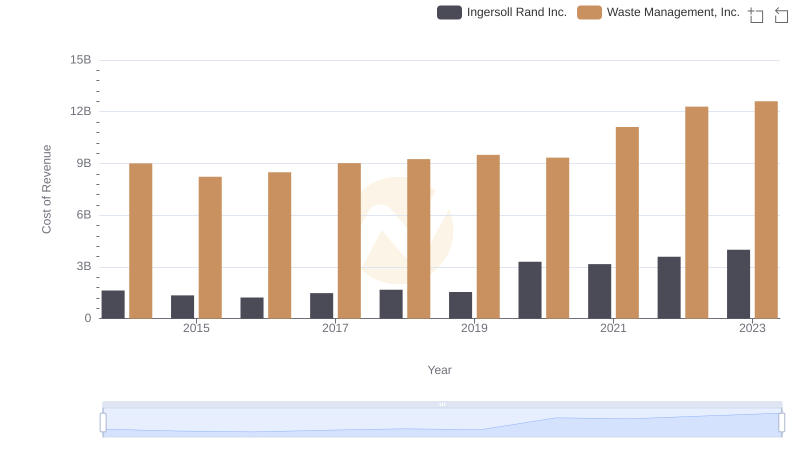
Cost of Revenue Comparison: Waste Management, Inc. vs Ingersoll Rand Inc.
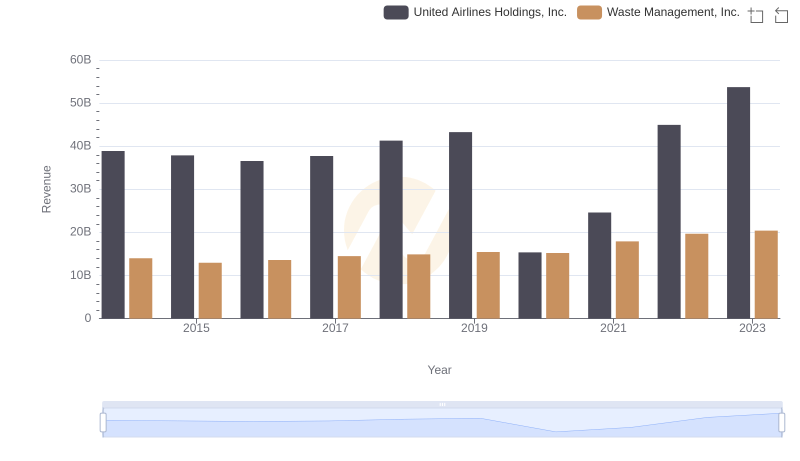
Waste Management, Inc. and United Airlines Holdings, Inc.: A Comprehensive Revenue Analysis
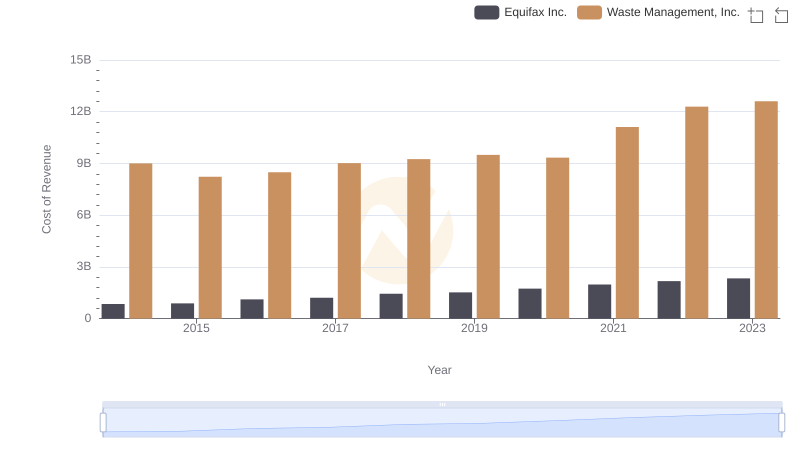
Comparing Cost of Revenue Efficiency: Waste Management, Inc. vs Equifax Inc.
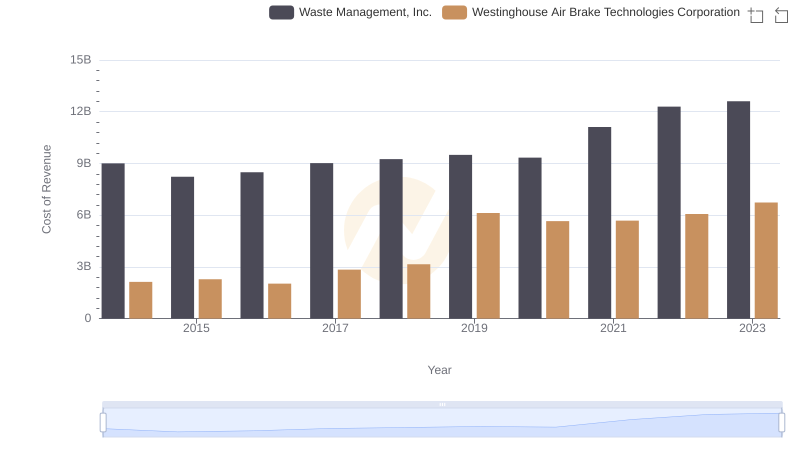
Cost of Revenue Comparison: Waste Management, Inc. vs Westinghouse Air Brake Technologies Corporation
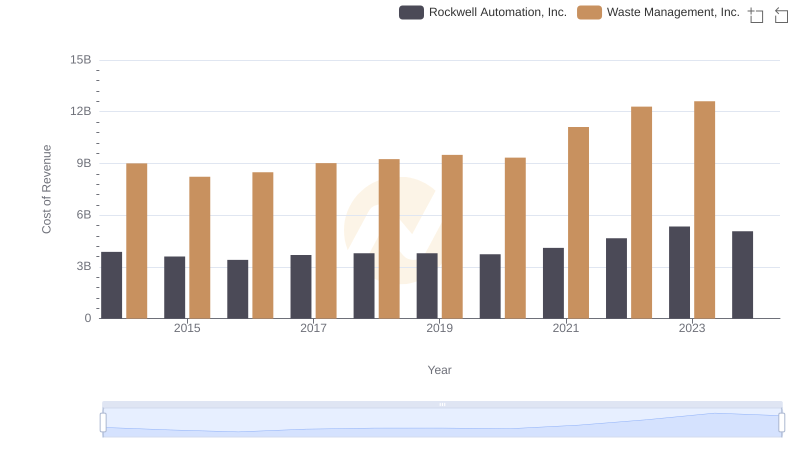
Cost of Revenue: Key Insights for Waste Management, Inc. and Rockwell Automation, Inc.
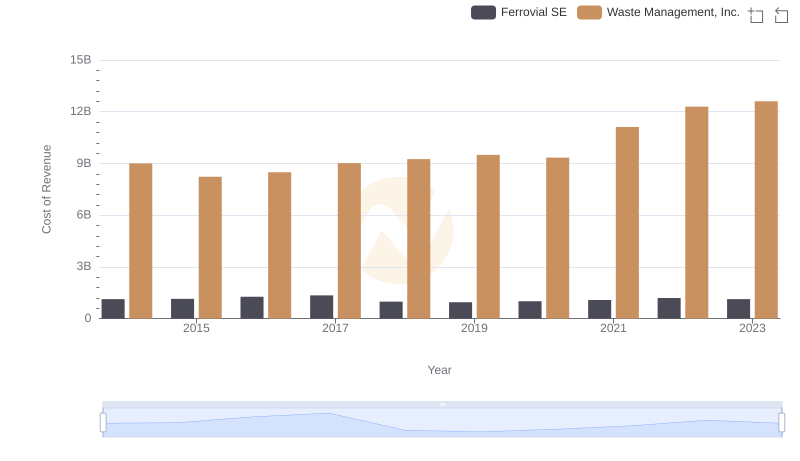
Cost of Revenue Comparison: Waste Management, Inc. vs Ferrovial SE
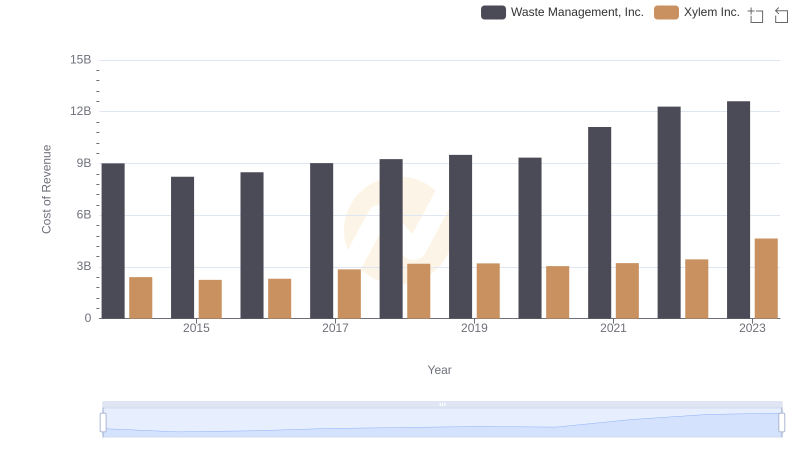
Cost of Revenue: Key Insights for Waste Management, Inc. and Xylem Inc.
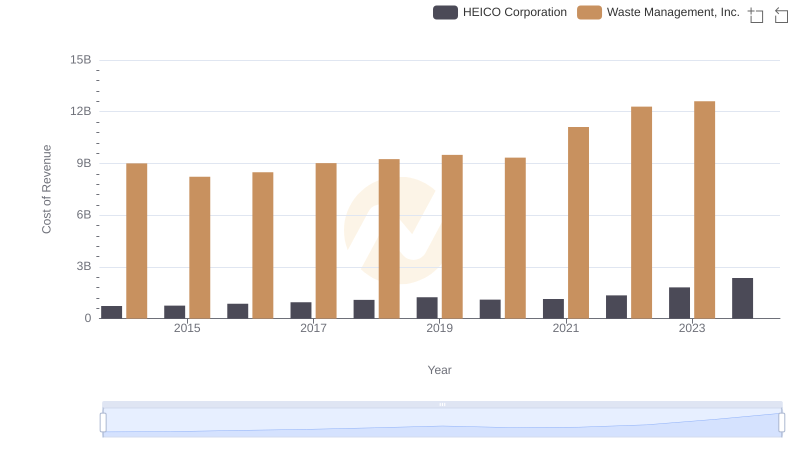
Comparing Cost of Revenue Efficiency: Waste Management, Inc. vs HEICO Corporation
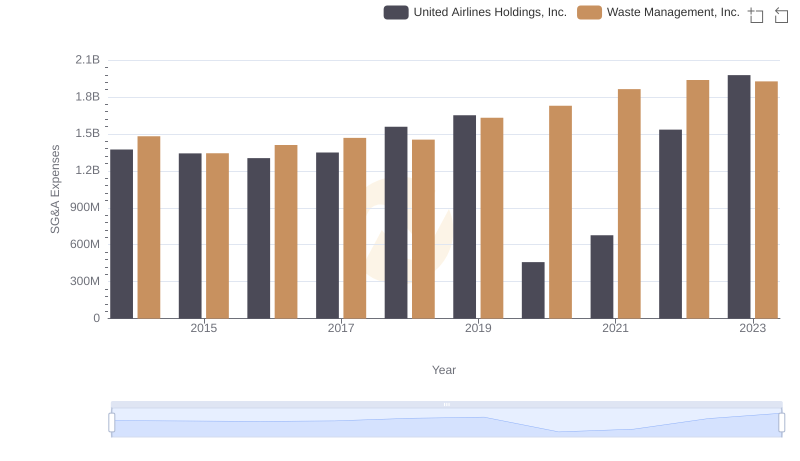
Waste Management, Inc. vs United Airlines Holdings, Inc.: SG&A Expense Trends
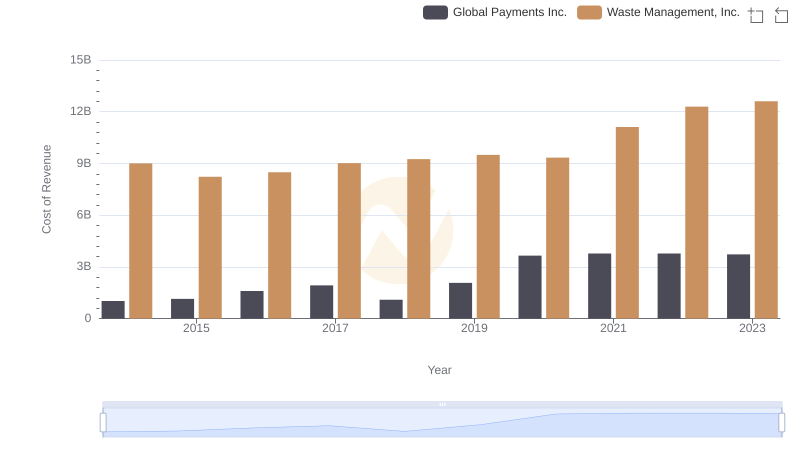
Cost of Revenue Trends: Waste Management, Inc. vs Global Payments Inc.