| __timestamp | J.B. Hunt Transport Services, Inc. | Waste Management, Inc. |
|---|---|---|
| Wednesday, January 1, 2014 | 926038000 | 3509000000 |
| Thursday, January 1, 2015 | 1055307000 | 3342000000 |
| Friday, January 1, 2016 | 1082601000 | 3713000000 |
| Sunday, January 1, 2017 | 1007307000 | 3996000000 |
| Monday, January 1, 2018 | 1116914000 | 4212000000 |
| Tuesday, January 1, 2019 | 1274241000 | 4344000000 |
| Wednesday, January 1, 2020 | 713119000 | 4149000000 |
| Friday, January 1, 2021 | 1045530000 | 4956000000 |
| Saturday, January 1, 2022 | 1331553000 | 5466000000 |
| Sunday, January 1, 2023 | 1738774000 | 5592000000 |
| Monday, January 1, 2024 | 5128000000 |
Unleashing the power of data
In the ever-evolving landscape of American industry, Waste Management, Inc. and J.B. Hunt Transport Services, Inc. have emerged as titans in their respective fields. Over the past decade, from 2014 to 2023, these companies have demonstrated remarkable EBITDA growth, a key indicator of financial health and operational efficiency.
Waste Management, Inc. has consistently outperformed, with its EBITDA growing by approximately 60% over this period. By 2023, it reached a peak, showcasing its resilience and strategic prowess in waste management services. Meanwhile, J.B. Hunt Transport Services, Inc. has also shown impressive growth, with its EBITDA increasing by nearly 88%, reflecting its adaptability and innovation in the transport sector.
This comparative analysis highlights the dynamic nature of these industries and underscores the importance of strategic management in achieving sustained financial success.
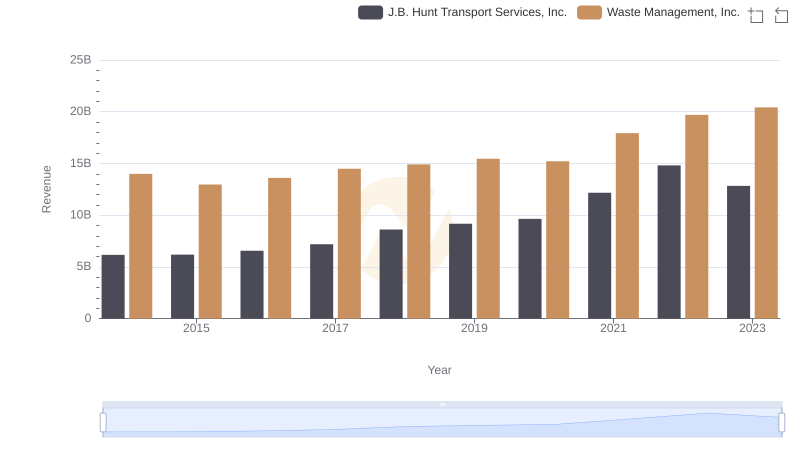
Waste Management, Inc. or J.B. Hunt Transport Services, Inc.: Who Leads in Yearly Revenue?
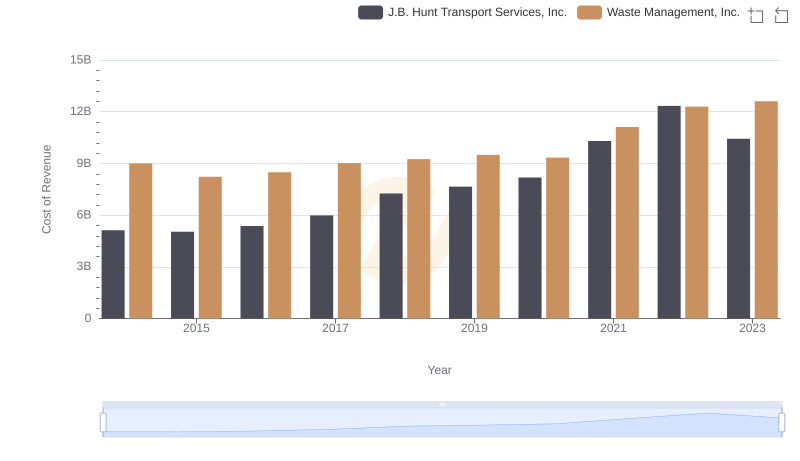
Cost of Revenue Trends: Waste Management, Inc. vs J.B. Hunt Transport Services, Inc.
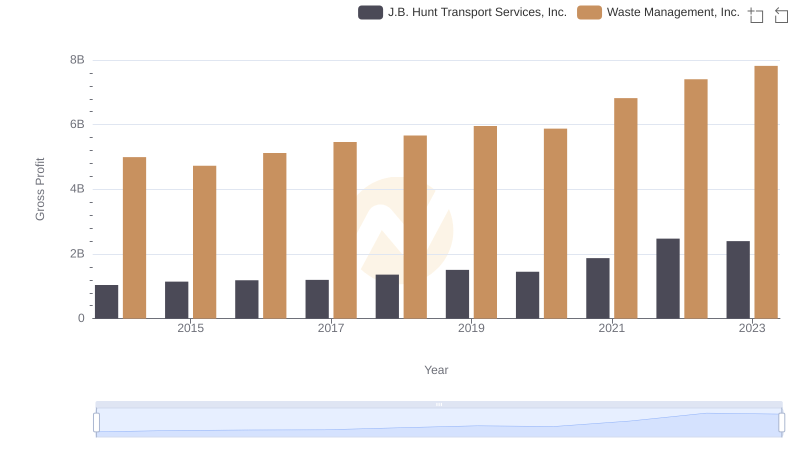
Gross Profit Analysis: Comparing Waste Management, Inc. and J.B. Hunt Transport Services, Inc.
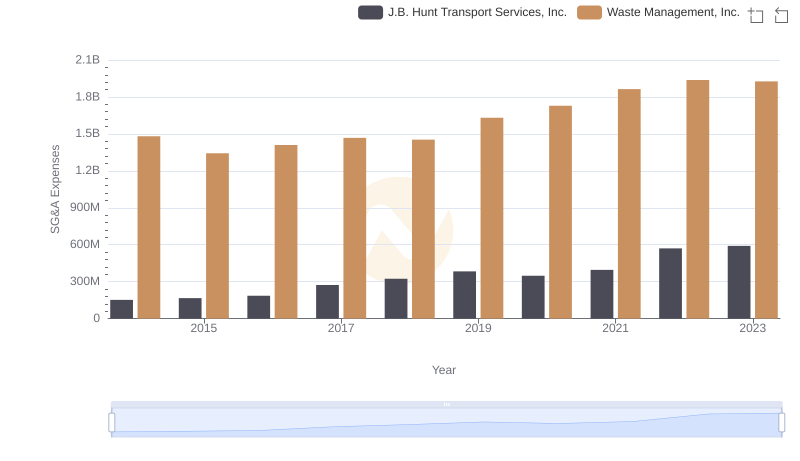
Waste Management, Inc. vs J.B. Hunt Transport Services, Inc.: SG&A Expense Trends
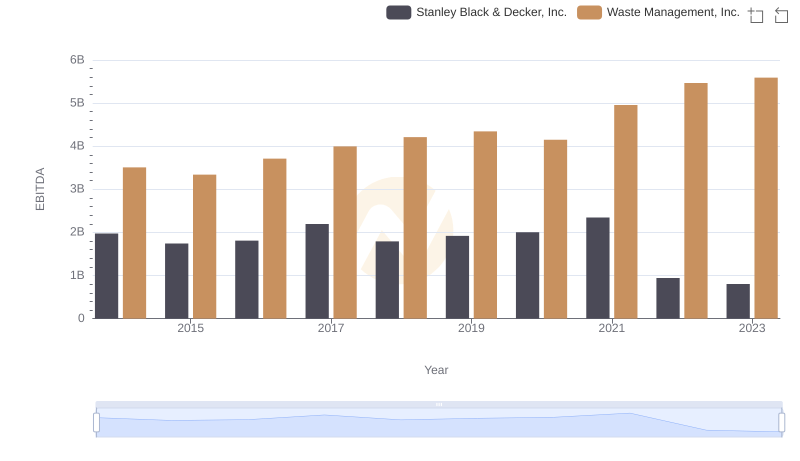
EBITDA Metrics Evaluated: Waste Management, Inc. vs Stanley Black & Decker, Inc.
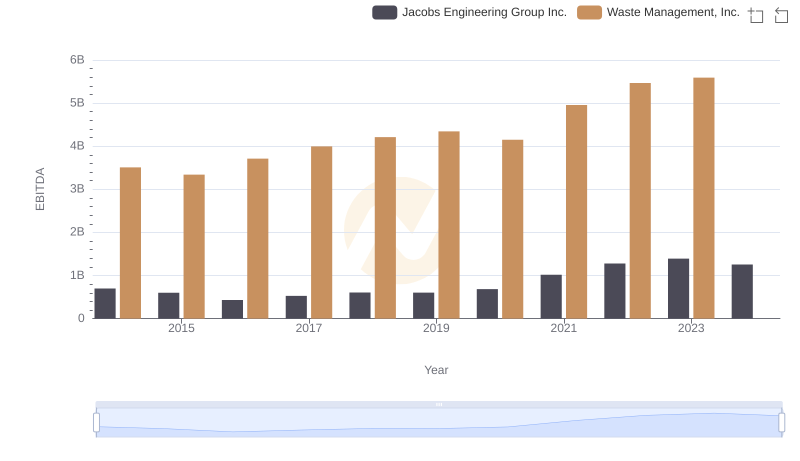
Comparative EBITDA Analysis: Waste Management, Inc. vs Jacobs Engineering Group Inc.
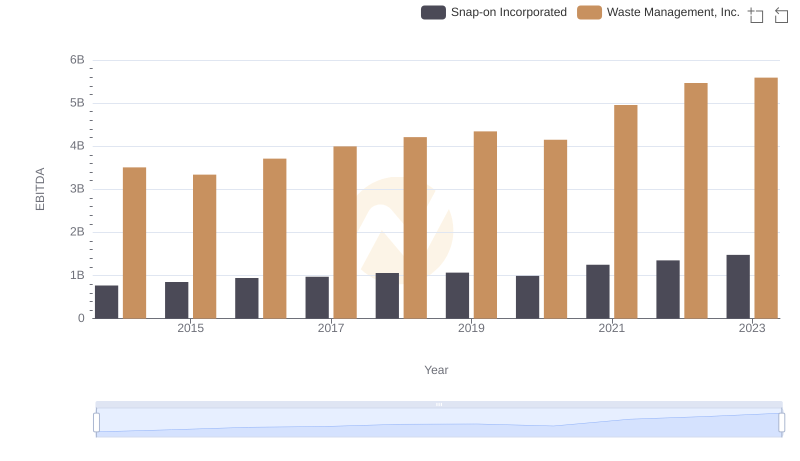
Professional EBITDA Benchmarking: Waste Management, Inc. vs Snap-on Incorporated
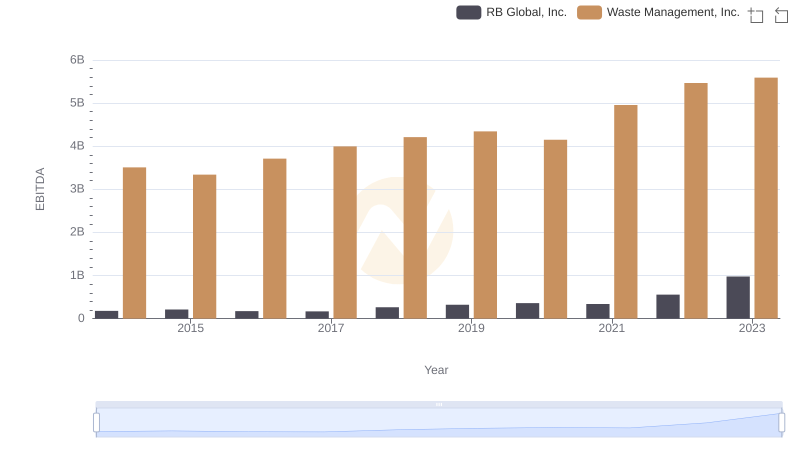
Waste Management, Inc. vs RB Global, Inc.: In-Depth EBITDA Performance Comparison
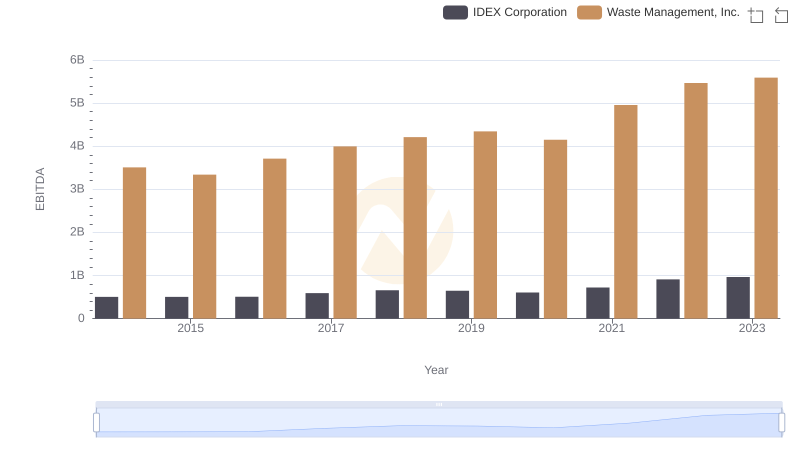
Professional EBITDA Benchmarking: Waste Management, Inc. vs IDEX Corporation