| __timestamp | J.B. Hunt Transport Services, Inc. | Waste Management, Inc. |
|---|---|---|
| Wednesday, January 1, 2014 | 5124095000 | 9002000000 |
| Thursday, January 1, 2015 | 5041472000 | 8231000000 |
| Friday, January 1, 2016 | 5369826000 | 8486000000 |
| Sunday, January 1, 2017 | 5990275000 | 9021000000 |
| Monday, January 1, 2018 | 7255657000 | 9249000000 |
| Tuesday, January 1, 2019 | 7659003000 | 9496000000 |
| Wednesday, January 1, 2020 | 8186697000 | 9341000000 |
| Friday, January 1, 2021 | 10298483000 | 11111000000 |
| Saturday, January 1, 2022 | 12341472000 | 12294000000 |
| Sunday, January 1, 2023 | 10433277000 | 12606000000 |
| Monday, January 1, 2024 | 13383000000 |
Igniting the spark of knowledge
In the ever-evolving landscape of the transportation and waste management industries, understanding cost dynamics is crucial. Over the past decade, Waste Management, Inc. and J.B. Hunt Transport Services, Inc. have showcased intriguing trends in their cost of revenue. From 2014 to 2023, Waste Management's cost of revenue has seen a steady increase, peaking at approximately $12.6 billion in 2023, marking a 40% rise from 2014. Meanwhile, J.B. Hunt's cost of revenue surged by over 100%, reaching around $12.3 billion in 2022 before slightly dipping in 2023. This growth reflects the companies' strategic adaptations to market demands and operational efficiencies. As these industry leaders continue to navigate economic challenges, their cost management strategies will be pivotal in maintaining competitive edges. Dive deeper into these trends to uncover the financial narratives shaping these sectors.
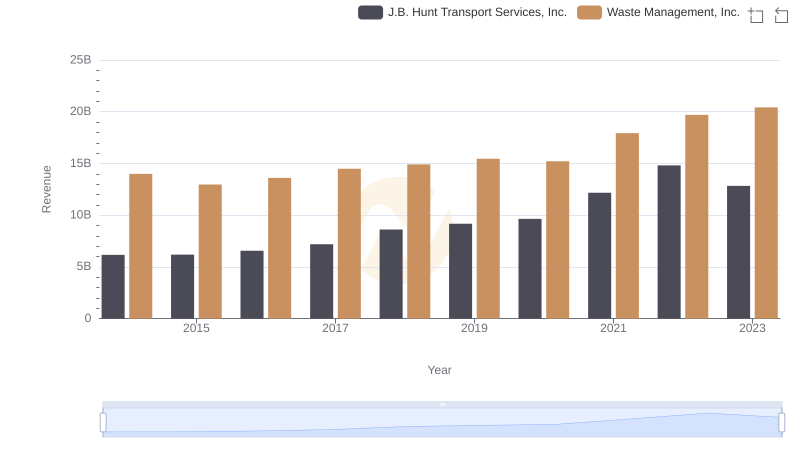
Waste Management, Inc. or J.B. Hunt Transport Services, Inc.: Who Leads in Yearly Revenue?
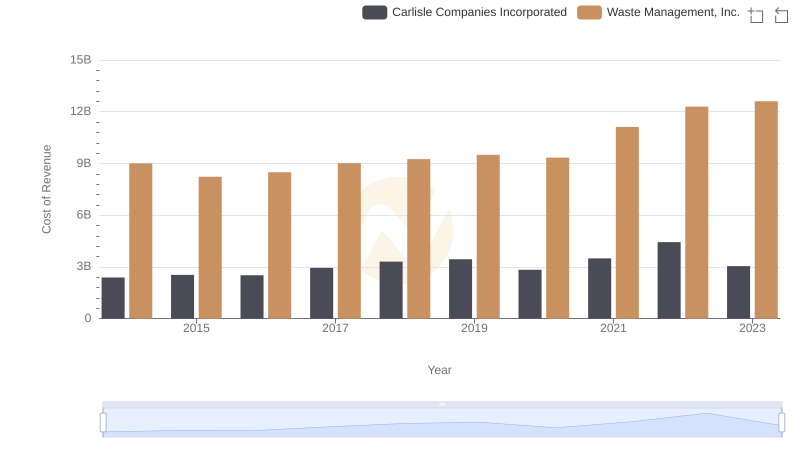
Waste Management, Inc. vs Carlisle Companies Incorporated: Efficiency in Cost of Revenue Explored
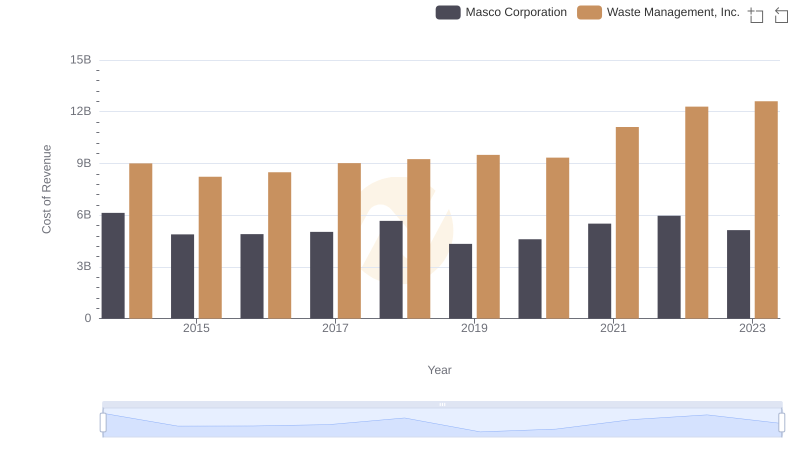
Cost Insights: Breaking Down Waste Management, Inc. and Masco Corporation's Expenses
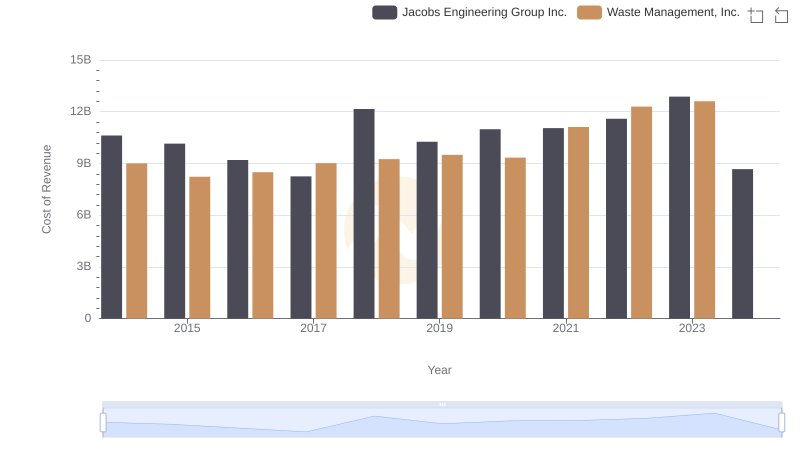
Cost of Revenue: Key Insights for Waste Management, Inc. and Jacobs Engineering Group Inc.
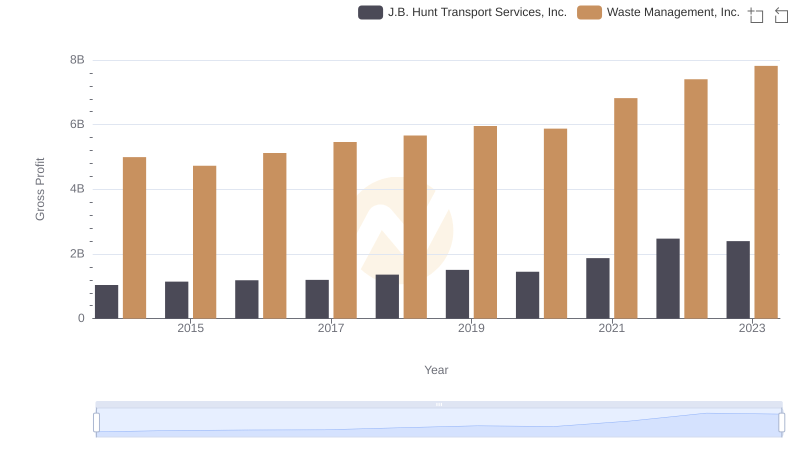
Gross Profit Analysis: Comparing Waste Management, Inc. and J.B. Hunt Transport Services, Inc.
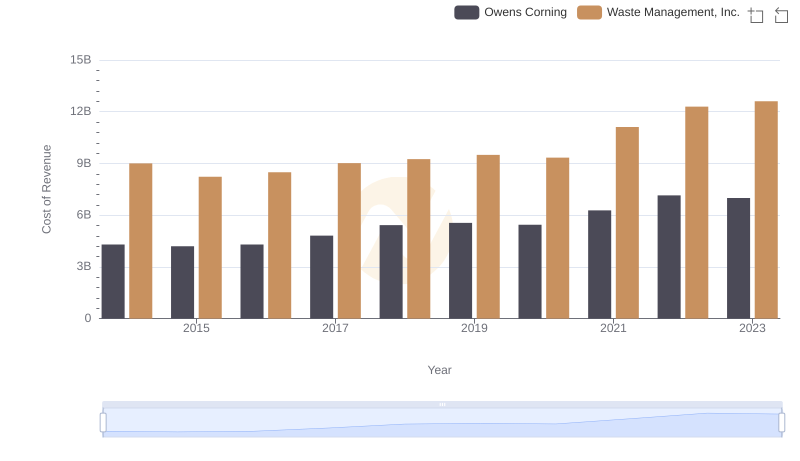
Comparing Cost of Revenue Efficiency: Waste Management, Inc. vs Owens Corning
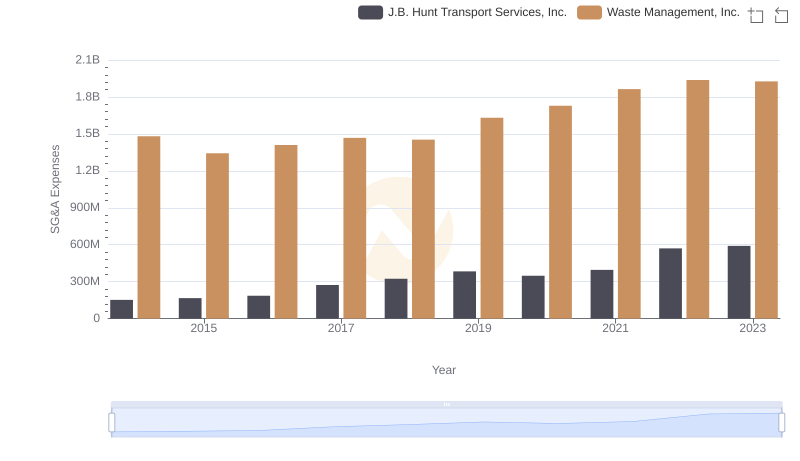
Waste Management, Inc. vs J.B. Hunt Transport Services, Inc.: SG&A Expense Trends
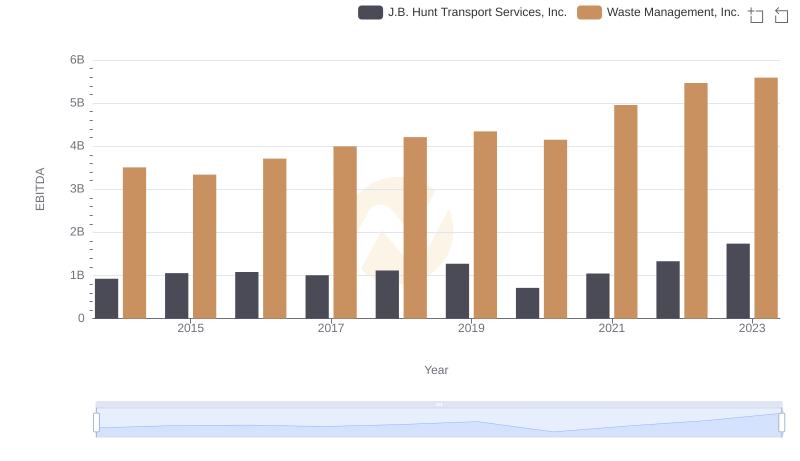
EBITDA Performance Review: Waste Management, Inc. vs J.B. Hunt Transport Services, Inc.